X-Ray concepts and architecture
Monitoring and troubleshooting AWS

John Q. Martin
Principal Consultant
The challenge of distributed systems
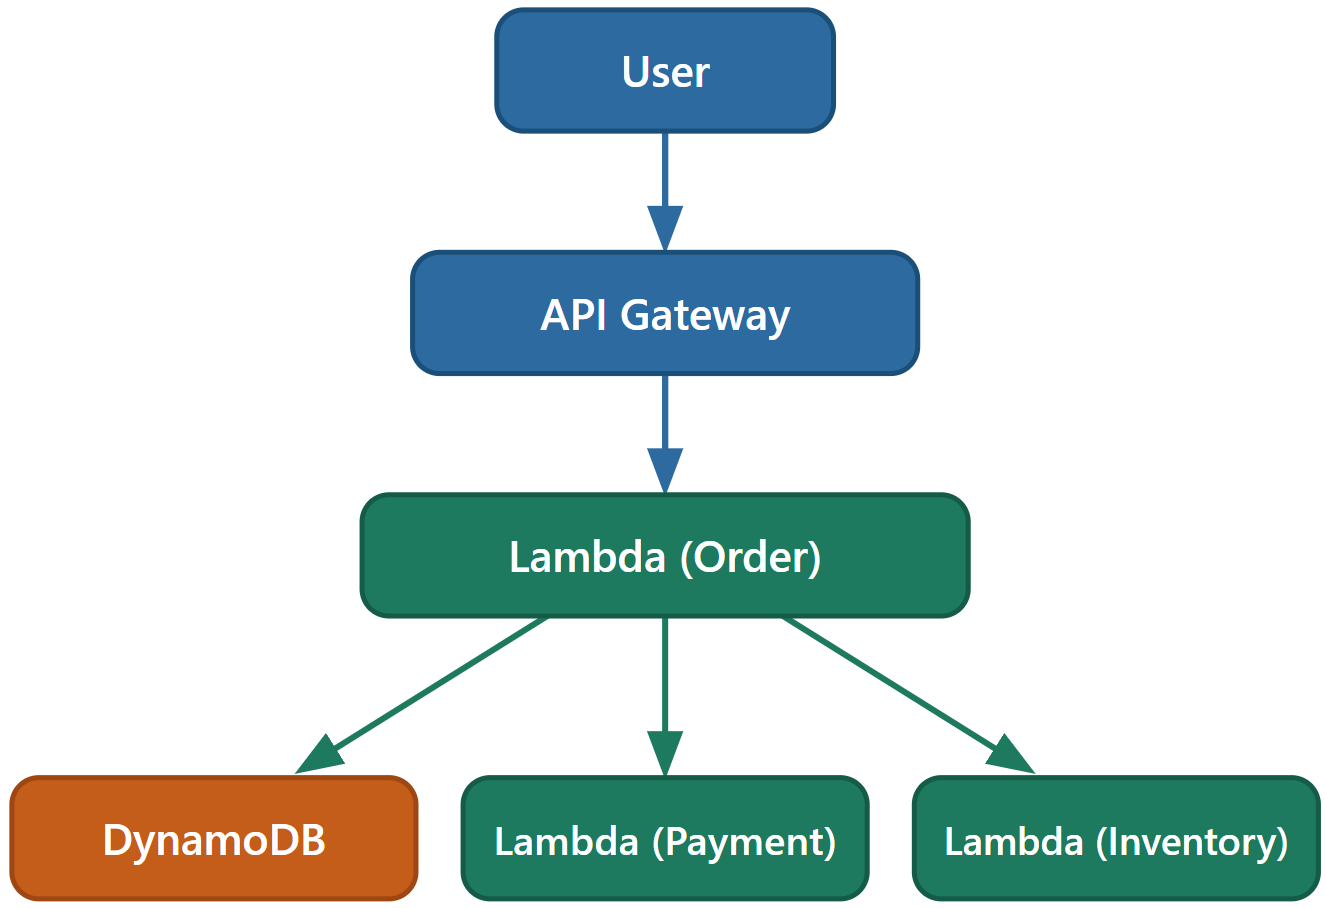
Distributed application
- One request touches multiple services, DBs, external APIs
- When it fails, which service caused it?

What is AWS X-Ray?
Example request path:
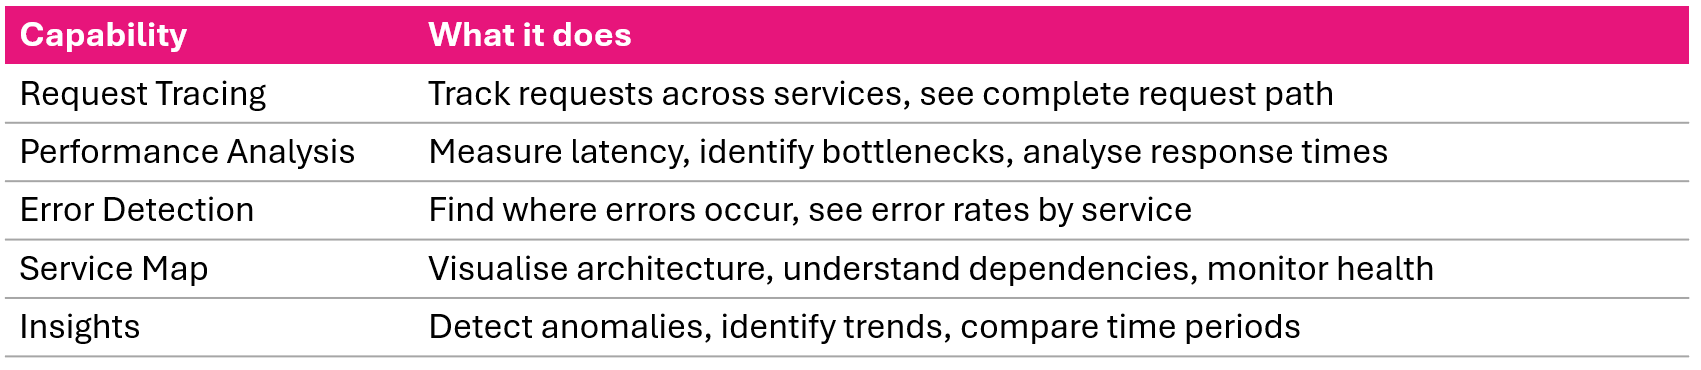
Five core capabilities
How tracing works
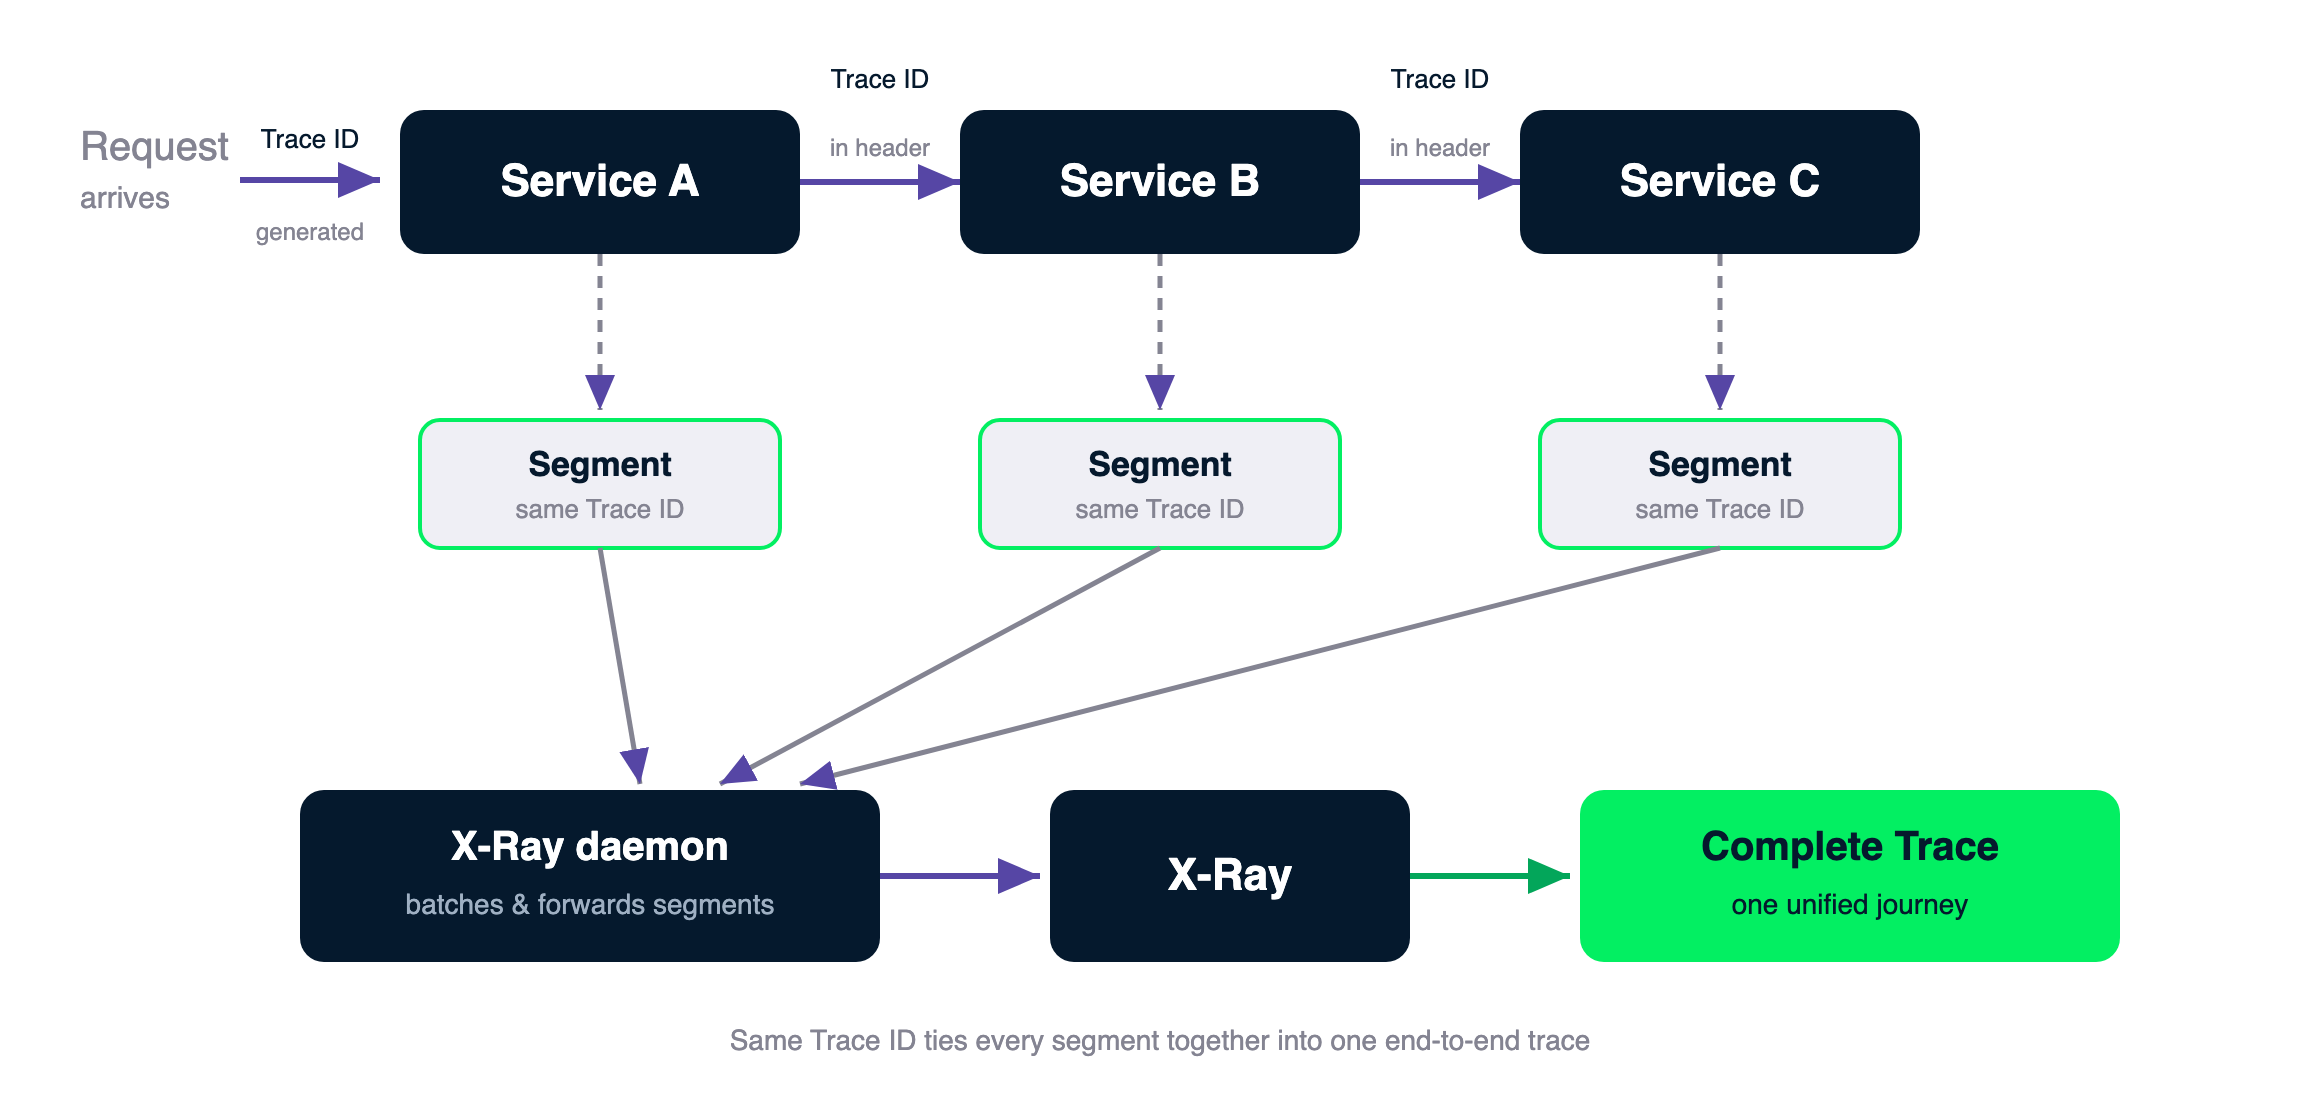
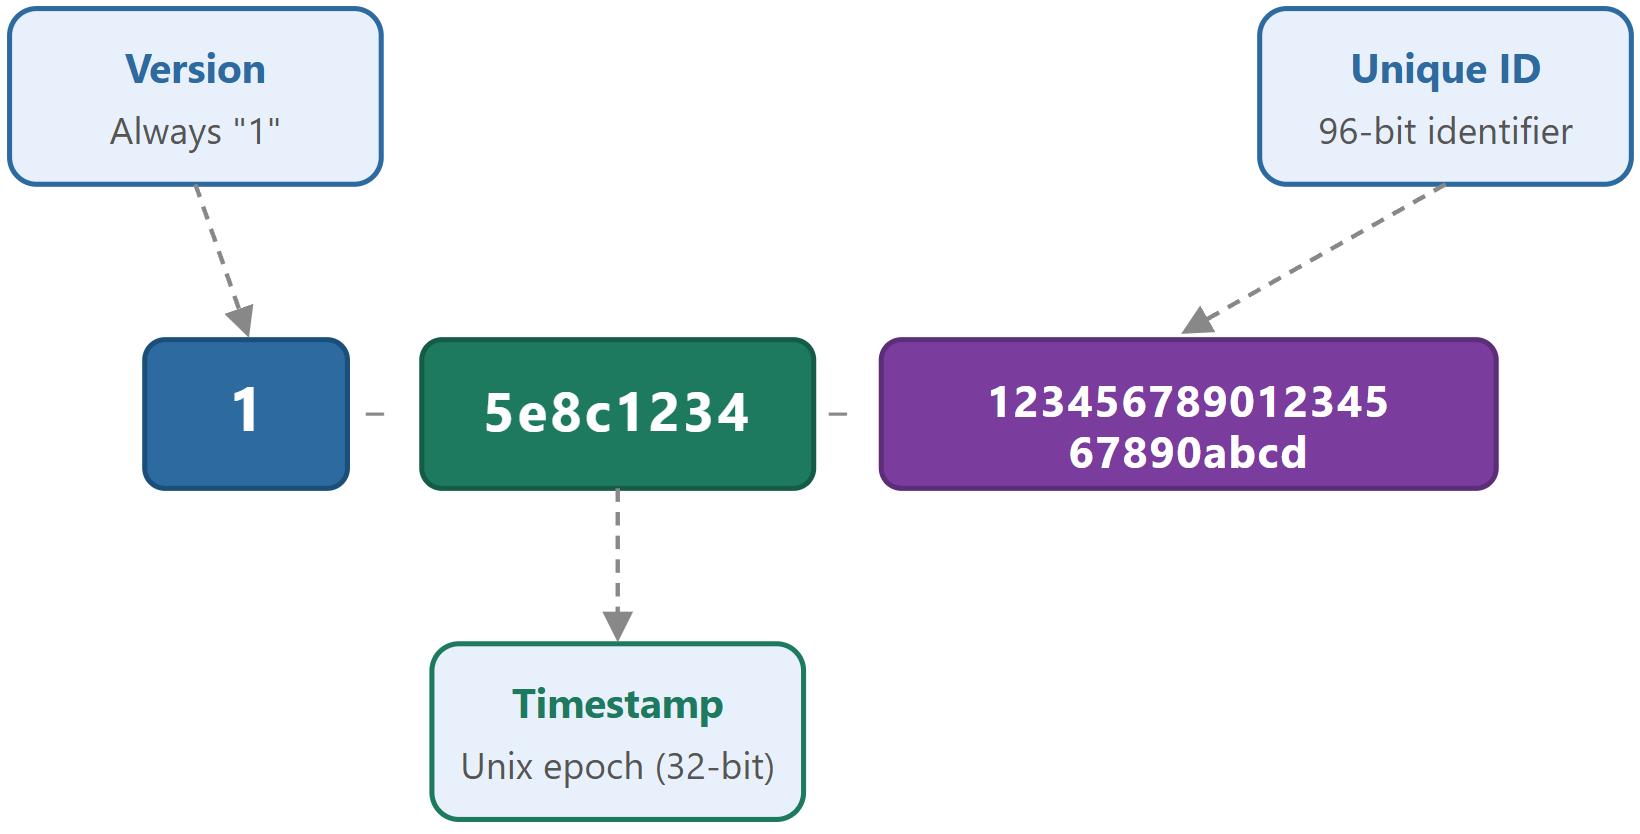
Trace ID and header propagation
Trace ID format:
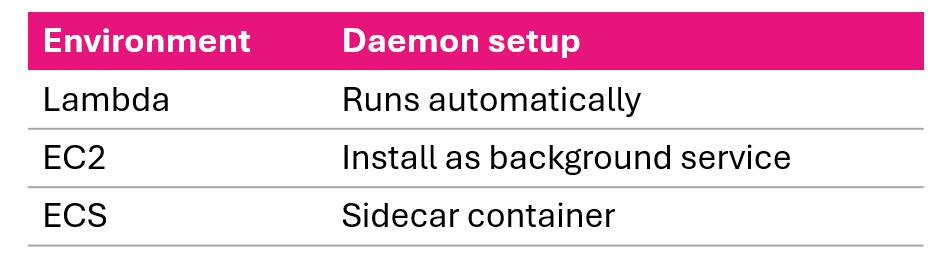
The X-Ray daemon
Deployment by environment:
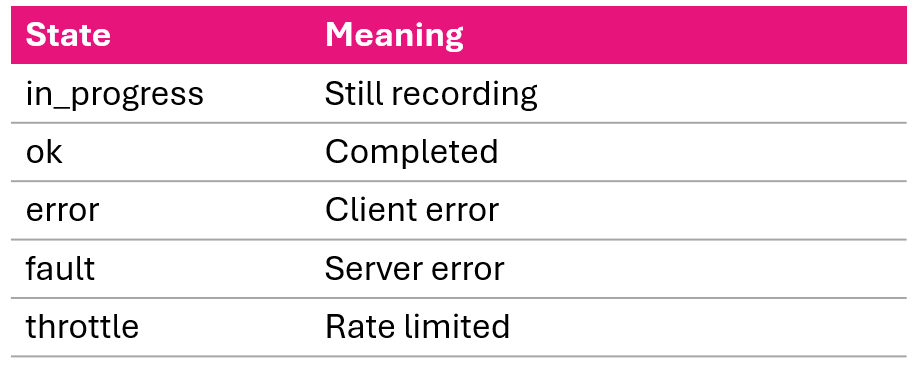
Segments
Segment states:
Subsegments
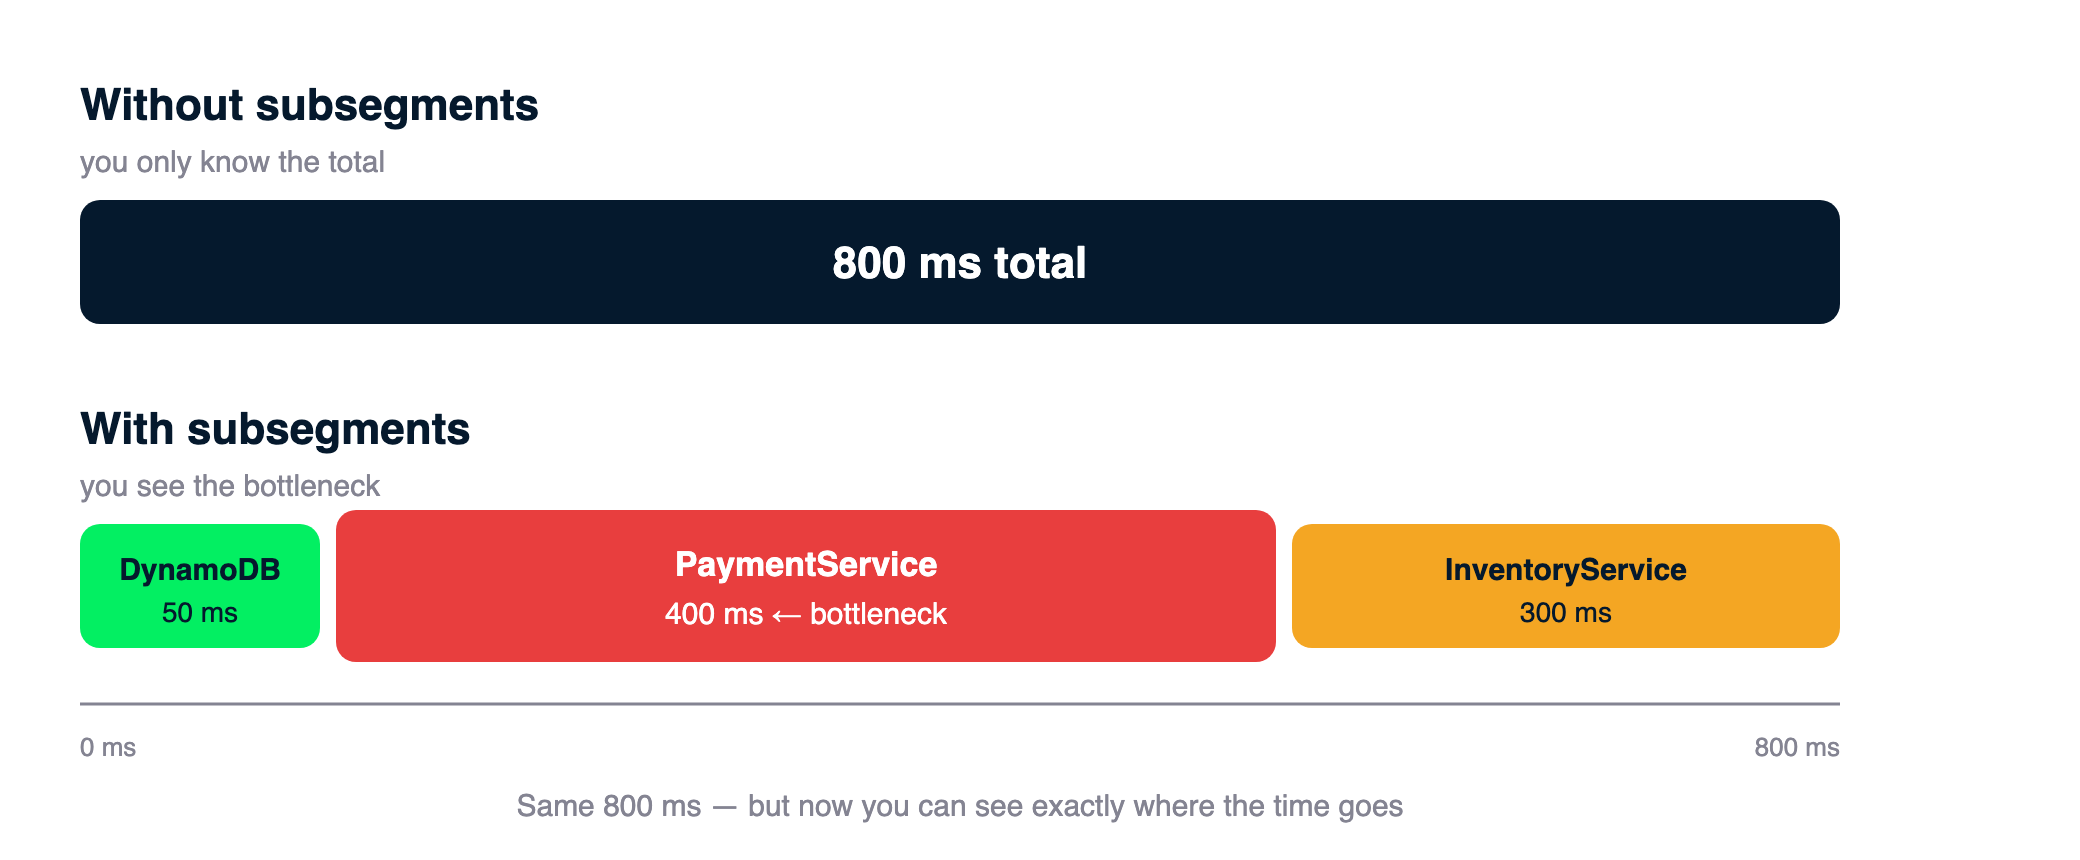
What subsegments do:
- Provide granular timing within a segment
- Track downstream calls
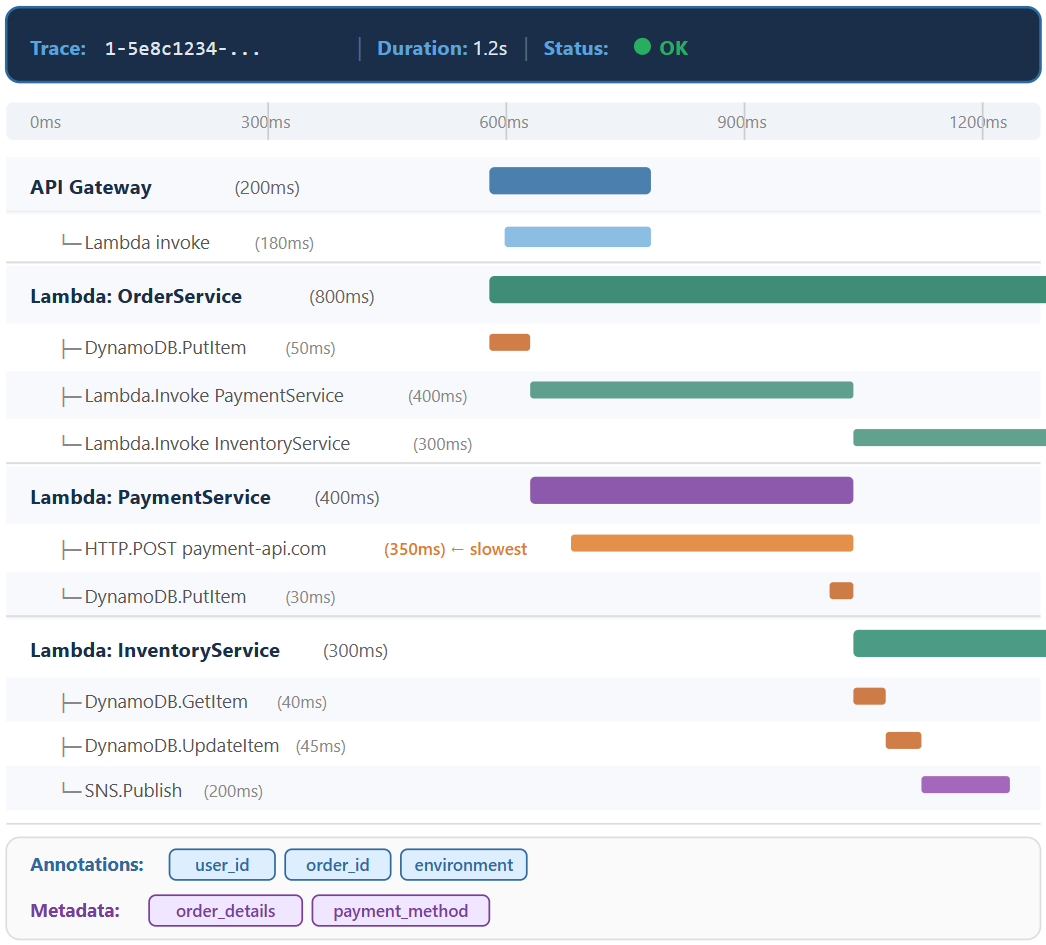
- Turn 800ms total into:
- DynamoDB.PutItem: 50ms
- PaymentService call: 400ms
- InventoryService call: 300ms
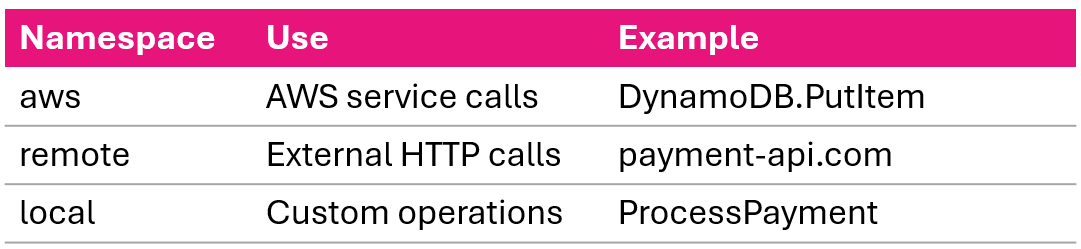
Namespaces:
Metadata
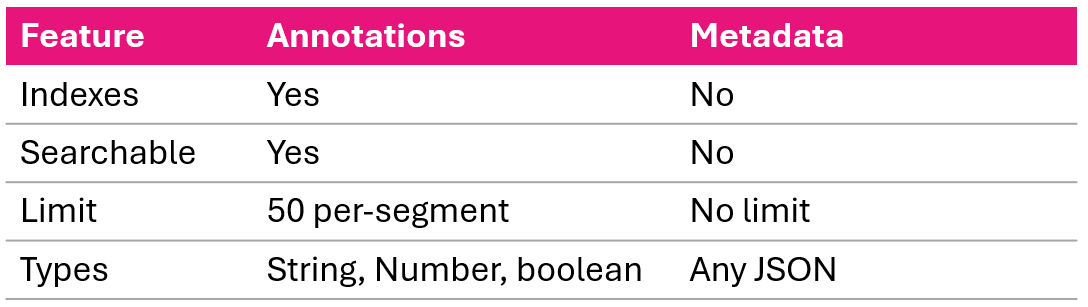
Annotations vs. Metadata:
Complete trace structure