複雑な実験からの洞察の統合

Pythonで学ぶ実験計画法

James Chapman

Curriculum Manager, DataCamp

製造歩留まりデータ

manufacturing_yield
 BatchID  MaterialType  ProductionSpeed  TemperatureSetting  YieldStrength
      39       Polymer           Medium             Optimal          58.83
     195         Metal             High                High          51.29
     462       Polymer             High             Optimal          55.15
     696     Composite           Medium                 Low          50.27
     142     Composite             High                 Low          57.62
  • 多因子計画:MaterialTypeProductionSpeedTemperatureSetting
  • 応答変数:YieldStrength
Pythonで学ぶ実験計画法

製造品質データ

manufacturing_quality
 BatchID ProductionSpeed  ProductQuality
     149             Low           93.87
     739            High           93.35
     617          Medium           90.45
     131            High           90.26
     684             Low           91.62
  • 計画:ProductionSpeed
  • 応答変数:ProductQuality
Pythonで学ぶ実験計画法

マージ戦略

merged_manufacturing = pd.merge(manufacturing_yield,
                       manufacturing_quality, 
                       on=['BatchID', 'ProductionSpeed'])
print(merged_manufacturing)
 BatchID  MaterialType  ProductionSpeed  TemperatureSetting  YieldStrength  ProductQuality
       1         Metal              Low                High          57.32           91.19
       5     Composite           Medium             Optimal          51.82           90.20
       7       Polymer              Low                High          56.12           91.66
       8     Composite             High             Optimal          50.91           93.05
      11       Polymer              Low                High          50.13           92.31
Pythonで学ぶ実験計画法

並列棒グラフ

import seaborn as sns
sns.catplot(x='MaterialType', y='YieldStrength', hue='ProductionSpeed', kind='bar', 
            data=merged_manufacturing)
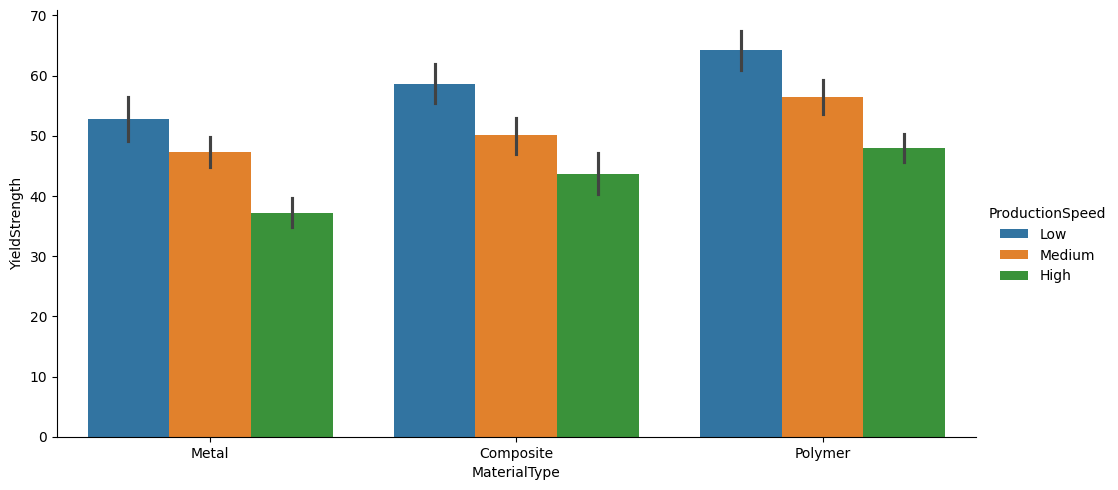
catplot.png

Pythonで学ぶ実験計画法

3変数散布図

sns.relplot(x='YieldStrength', y='ProductQuality', hue='ProductionSpeed', 
            kind='scatter', data=merged_manufacturing)
plt.title('Yield Strength vs. Product Quality by Production Speed')
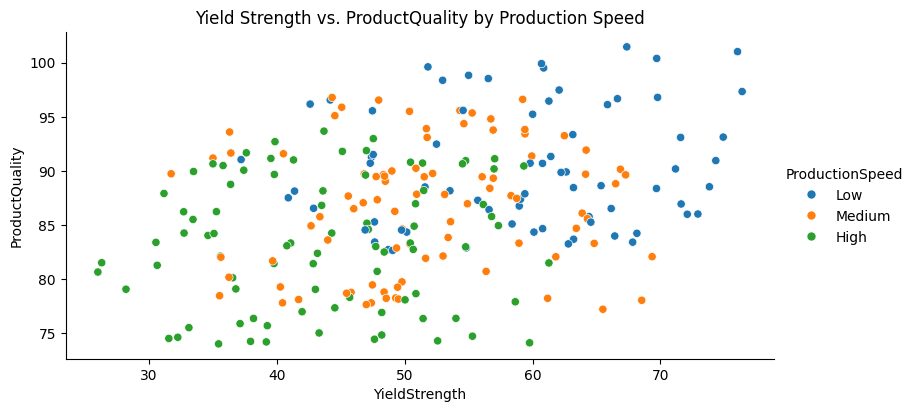
生産速度別の降伏強度と製品品質

Pythonで学ぶ実験計画法

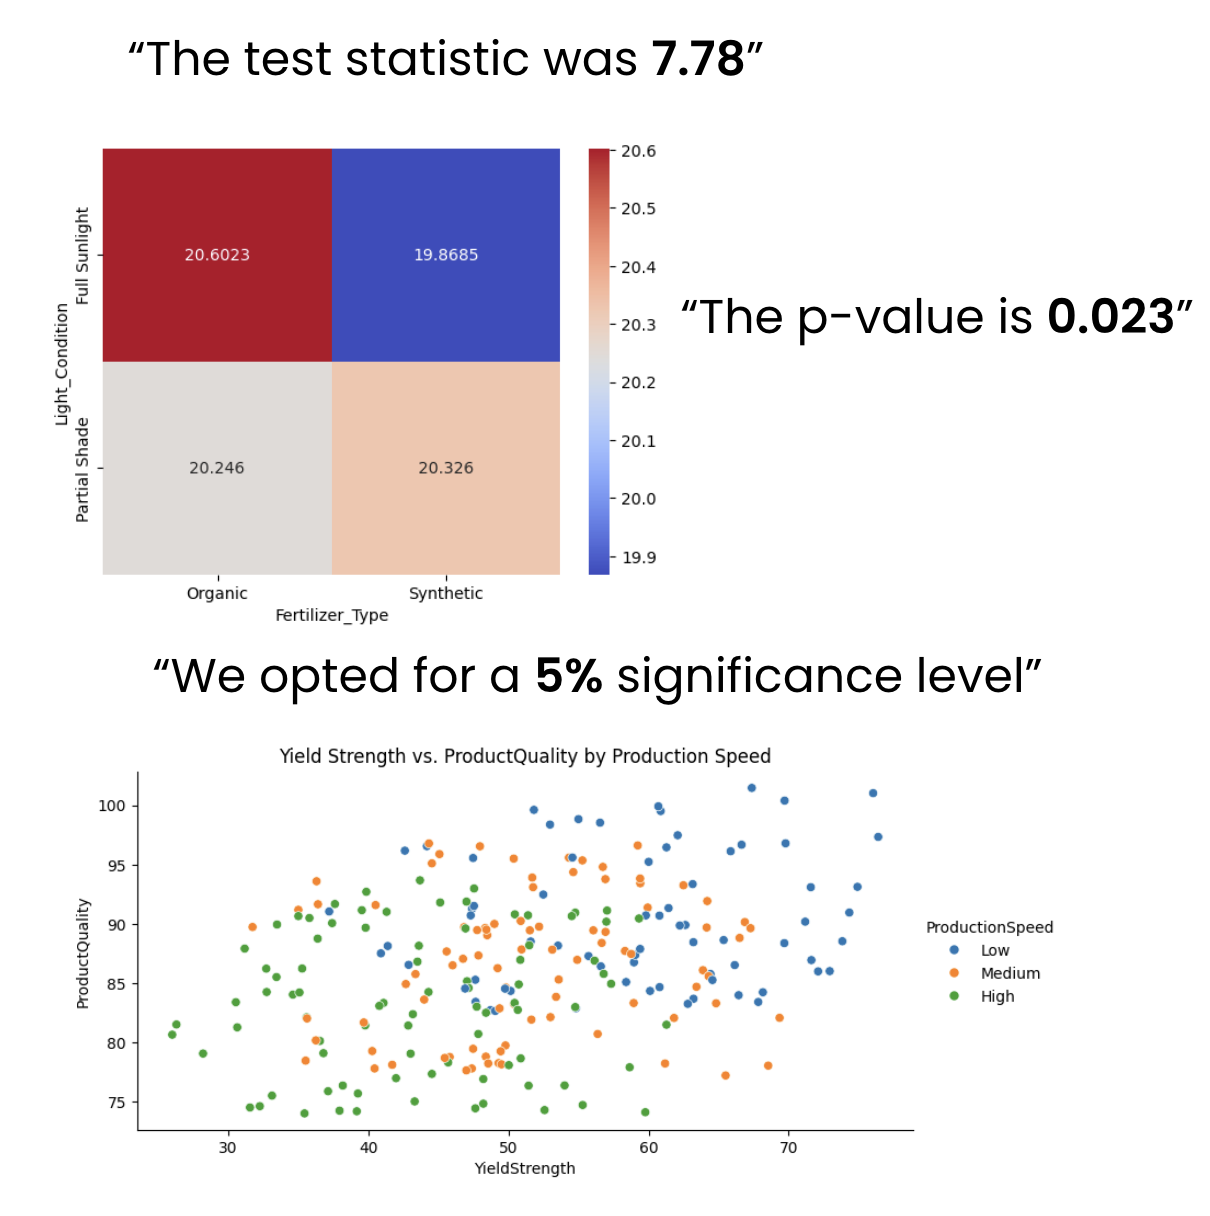
技術的な聴衆へのデータ伝達


  • データナラティブの構築
    • p値
    • 検定統計量
    • 有意水準
  • 複雑なデータの可視化
    • ヒートマップ
    • 多色散布図
    • 投影

技術的な聴衆へのプレゼンテーション

Pythonで学ぶ実験計画法

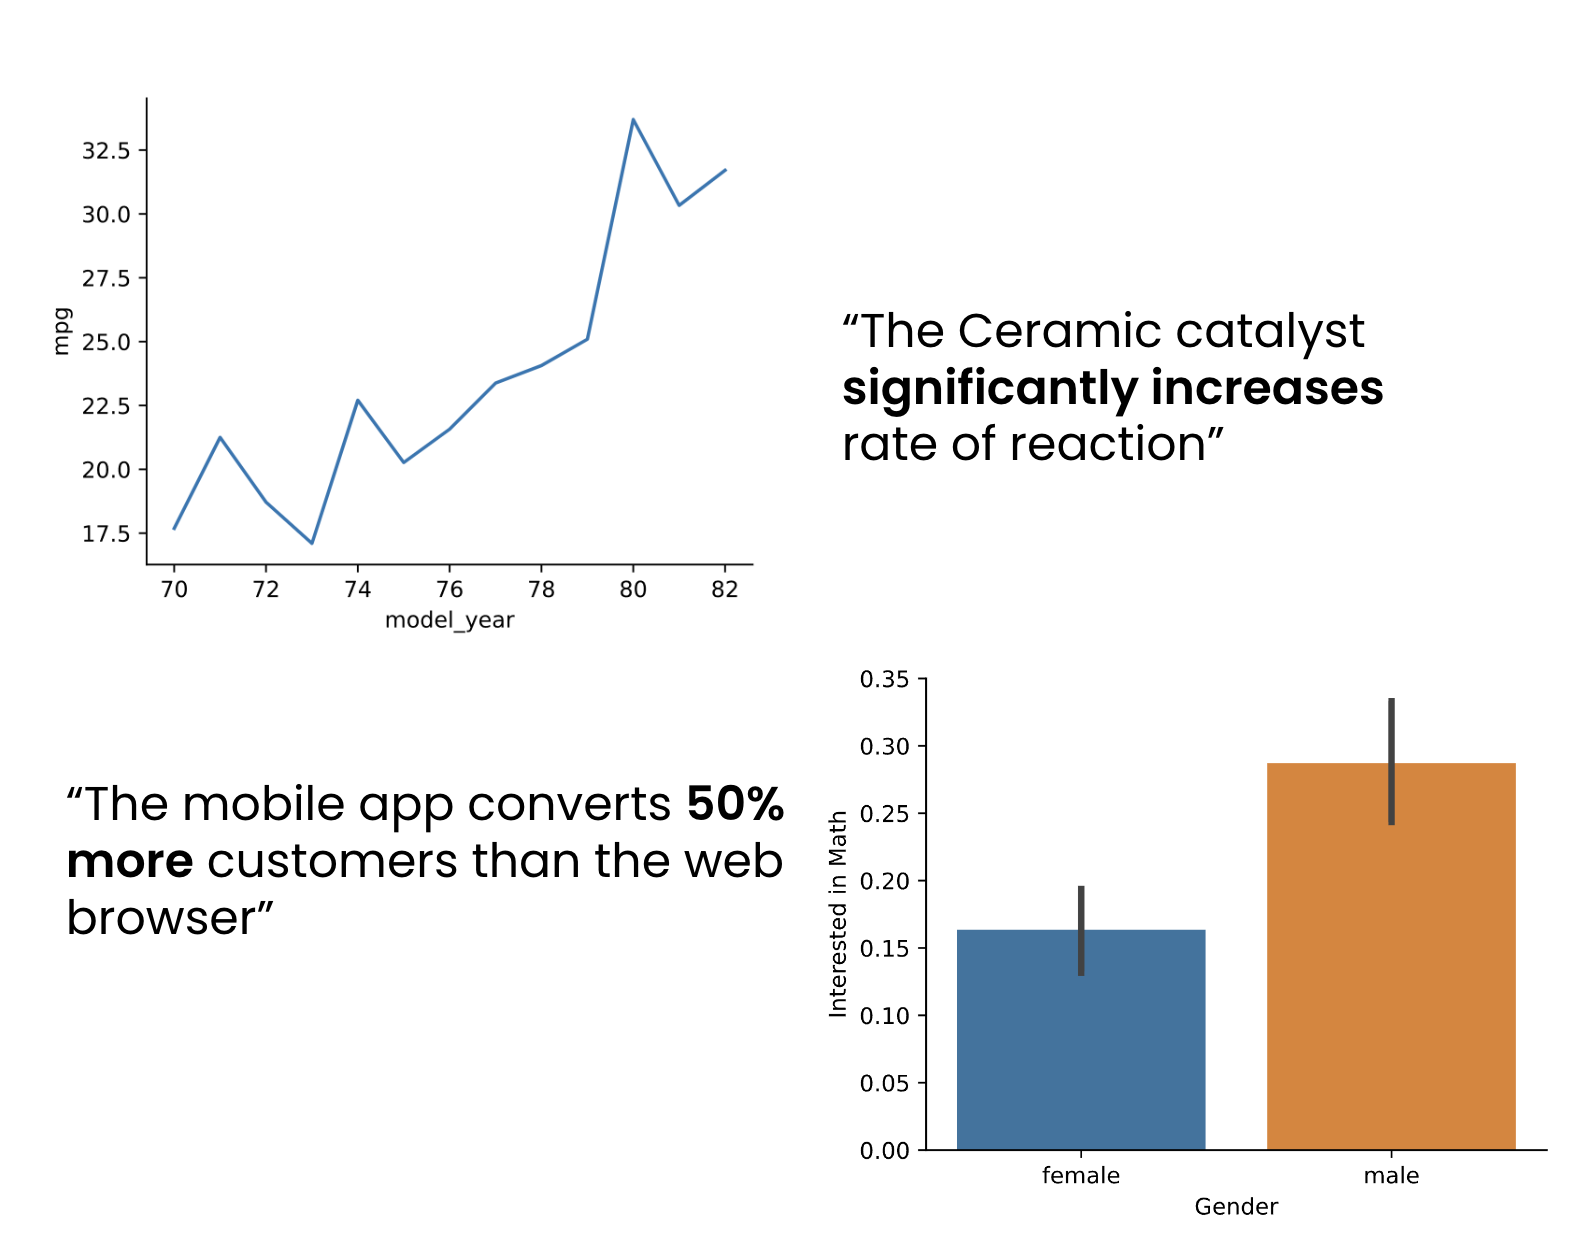
非技術的な聴衆へのデータ活用


  • データの洞察を簡潔に伝える
    • 基本的な可視化:棒グラフと折れ線グラフ
  • 聴衆中心のプレゼンテーション準備
    • データはなぜ重要か?
    • 洞察を実世界の応用に結びつける

データストーリーテリング

Pythonで学ぶ実験計画法

練習しましょう!

Pythonで学ぶ実験計画法

Preparing Video For Download...