線形モデルの説明可能性

Pythonで学ぶExplainable AI

Fouad Trad

Machine Learning Engineer

線形モデル

線形回帰
  • 連続値を予測

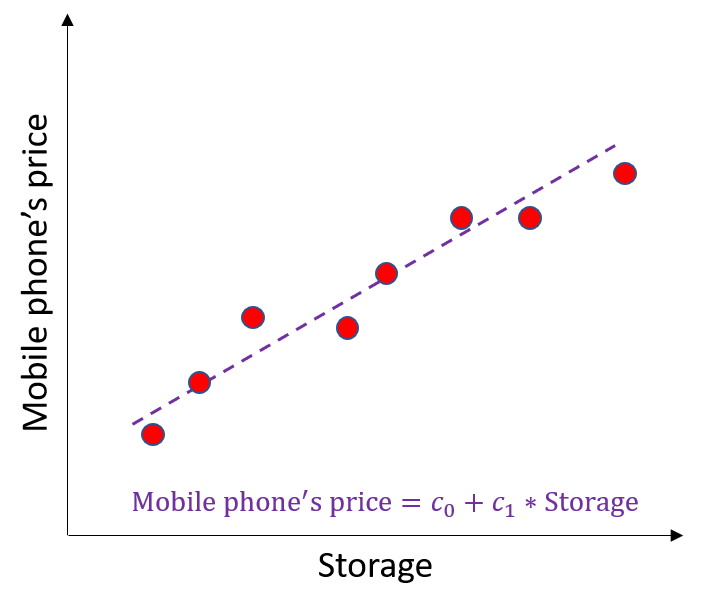
複数点にフィットする直線の図。x軸はテストスコア、y軸は合格確率。

Pythonで学ぶExplainable AI

線形モデル

線形回帰
  • 連続値を予測

複数点にフィットする直線の図。x軸はテストスコア、y軸は合格確率。

ロジスティック回帰
  • 二値分類に使用

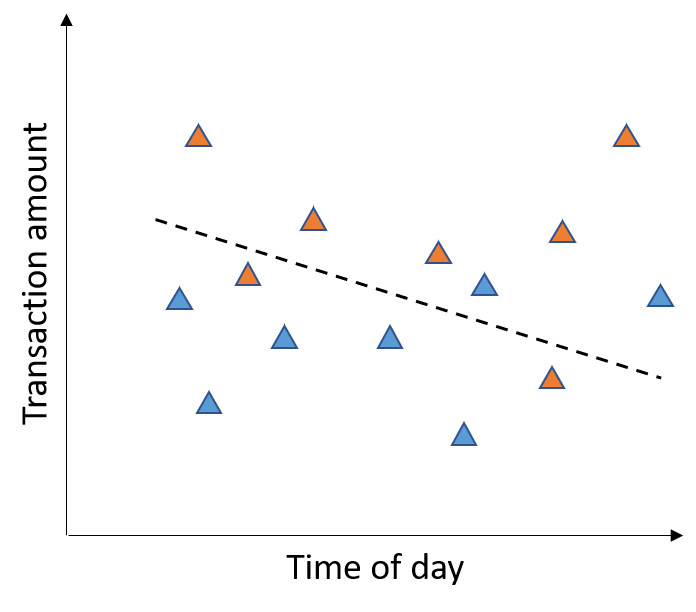
複数の取引データ点を、取引金額と実行時刻に基づく直線で分離する図。

Pythonで学ぶExplainable AI

なぜ線形モデルは説明可能か

  • 入力特徴量の線形結合を学習
  • $c_0 + c_1 \times \text{feature}_1 + c_2 \times \text{feature}_2 + \ldots + c_n \times \text{feature}_n$
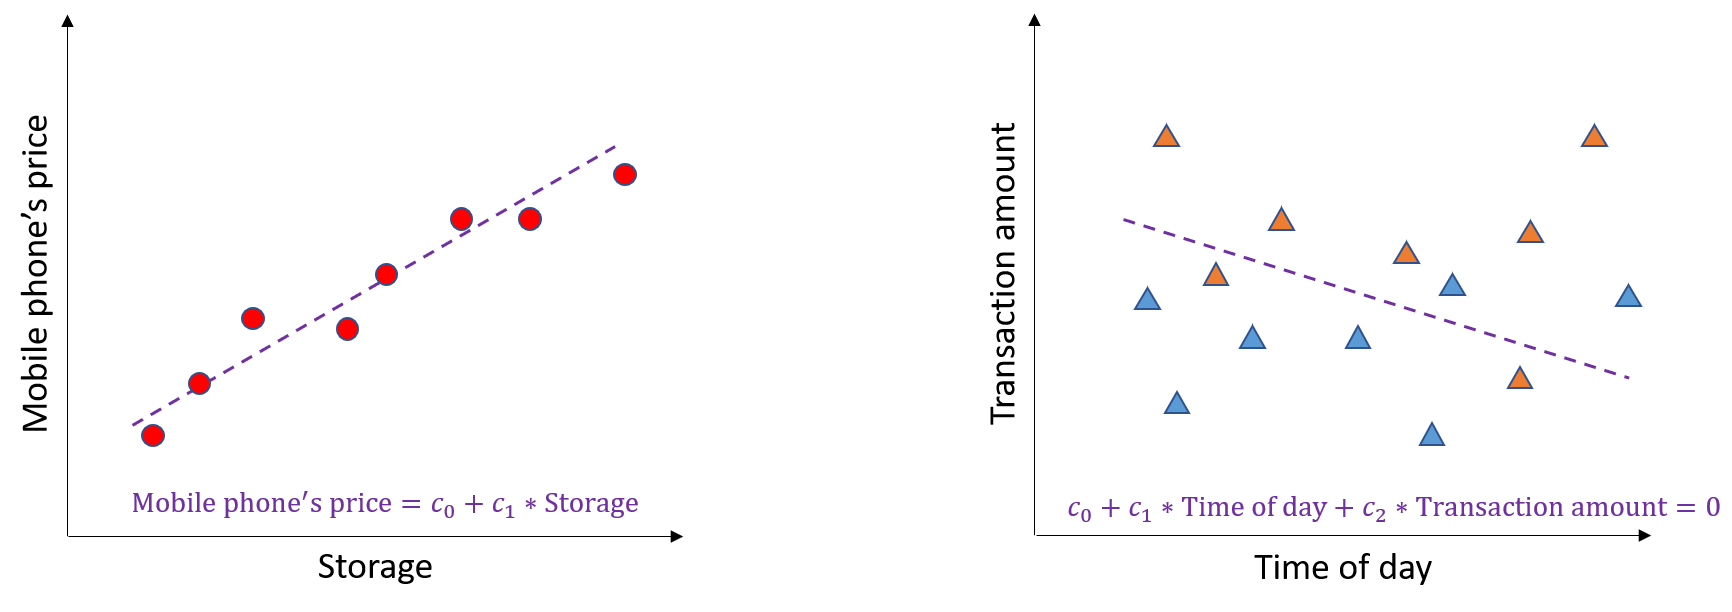
先の線形・ロジスティック回帰の図に、学習する式を表示。線形回帰: Mobile price=푐_0+푐_1∗Storage。ロジスティック回帰: 푐_0+푐_1∗Time of day+푐_2∗Transaction amount=0

Pythonで学ぶExplainable AI

係数

  • 各特徴量の重要度を示す
    • 絶対値が大きい → 重要度が高い
    • 絶対値が小さい → 重要度が低い
  • 係数の比較は絶対値で行う
  • 注: 係数算出前に特徴量を正規化する

式「モバイル価格=푐_0+5∗Storage+2∗Number of lenses」を示し、係数を強調する画像。

Pythonで学ぶExplainable AI

係数

  • 各特徴量の重要度を示す
    • 絶対値が大きい → 重要度が高い
    • 絶対値が小さい → 重要度が低い
  • 係数を比較する際は絶対値を見る
  • 注: 係数算出前に特徴量を正規化する

式「モバイル価格=𝑐_0+𝑐_1∗Storage+c_2∗Number of lenses」を示し、Storageは数百〜数千GB、レンズ数は通常4未満であることを強調する画像。

Pythonで学ぶExplainable AI

入学審査データ

GREスコア TOEFLスコア 大学評価 SOP LOR CGPA 合格確率 合否
337 118 4 4.5 4.5 9.65 0.92 1
324 107 4 4 4.5 8.87 0.76 1
316 104 3 3 3.5 8 0.72 1
322 110 3 3.5 2.5 8.67 0.8 1
314 103 2 2 3 8.21 0.45 0
X_train = data.drop(['Chance of Admit', 'Accept'], axis=1)

y_reg = data['Chance of Admit']
y_cls = data['Accept']
Pythonで学ぶExplainable AI

モデル学習

from sklearn.preprocessing import MinMaxScaler
from sklearn.linear_model import LinearRegression, LogisticRegression


scaler = MinMaxScaler() X_train_scaled = scaler.fit_transform(X_train)
lin_reg = LinearRegression() lin_reg.fit(X_train_scaled, y_reg)
log_reg = LogisticRegression() log_reg.fit(X_train_scaled, y_cls)
Pythonで学ぶExplainable AI

係数の算出

線形回帰
print(lin_reg.coef_)
[0.03052087 0.01665433 0.00668971 
 0.00326926 0.01724815 0.0661691 ]
ロジスティック回帰
print(log_reg.coef_)
[[1.28985577  0.49441086  0.47593379 
  0.05434322  0.41800927  1.31980189]]
Pythonで学ぶExplainable AI

係数の可視化

線形回帰
import matplotlib.pyplot as plt
plt.bar(X_train.columns, lin_reg.coef_)
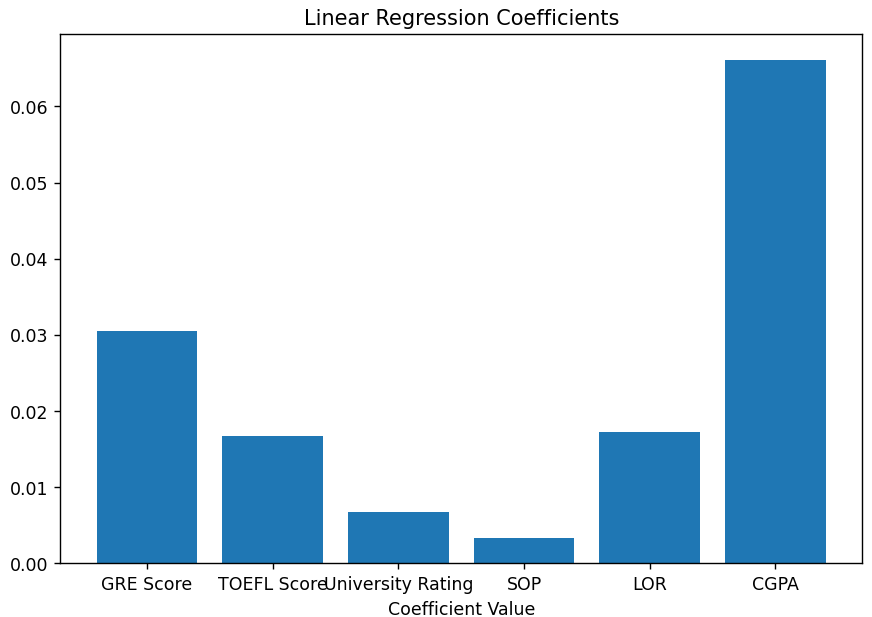
棒グラフで重要度を示し、CGPAとGREスコアが最も重要であることを示す図。

ロジスティック回帰
import matplotlib.pyplot as plt
plt.bar(X_train.columns, log_reg.coef_[0])
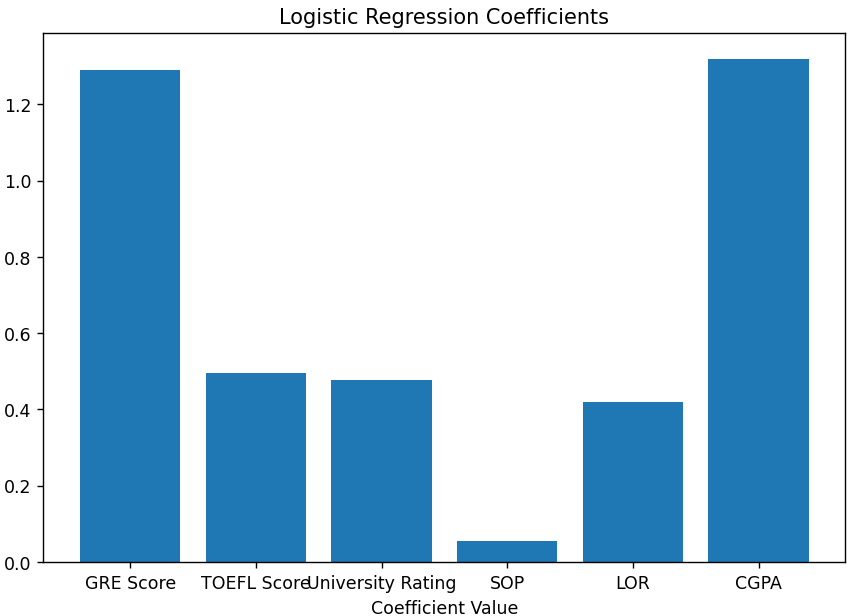
棒グラフで重要度を示し、CGPAとGREスコアが最も重要であることを示す図。

Pythonで学ぶExplainable AI

Passons à la pratique !

Pythonで学ぶExplainable AI

Preparing Video For Download...