スペクトログラム - 時間的なスペクトル変化

Pythonで学ぶMachine Learningによる時系列データ解析

Chris Holdgraf

Fellow, Berkeley Institute for Data Science

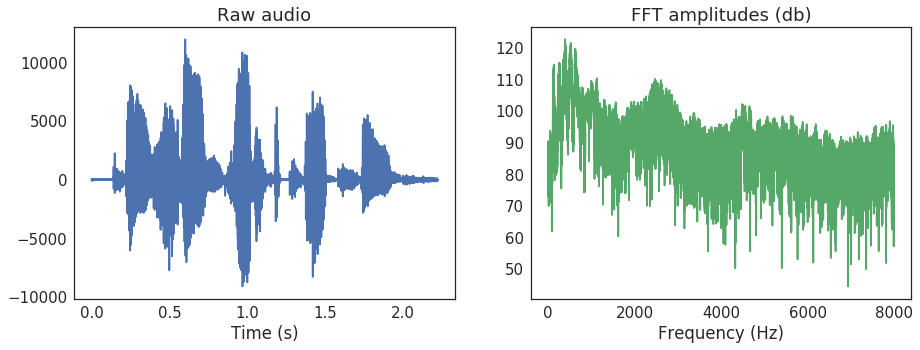
フーリエ変換

  • 時系列データは、速く変化する成分と遅く変化する成分の組み合わせで表現できます。
  • 各時点において、高速・低速成分の相対的な存在量を記述できます。
  • その最もシンプルな方法がフーリエ変換です。
  • 時系列を振動の組み合わせとして表す配列に変換します。
Pythonで学ぶMachine Learningによる時系列データ解析

フーリエ変換(FFT)

Pythonで学ぶMachine Learningによる時系列データ解析

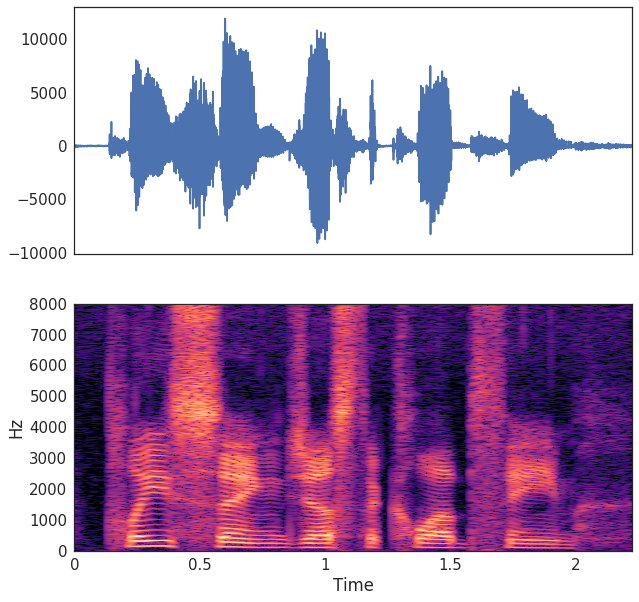
スペクトログラム:窓付きフーリエ変換の組み合わせ

  • スペクトログラムは、時間方向に沿った窓付きフーリエ変換の集合です。
  • ローリング平均の計算と同様の手順で求められます:
    1. 窓サイズと形状を選択する
    2. 各時点で窓内のFFTを計算する
    3. 窓を1つずらす
    4. 結果を集約する
  • これを短時間フーリエ変換(STFT)と呼びます。
Pythonで学ぶMachine Learningによる時系列データ解析

Pythonで学ぶMachine Learningによる時系列データ解析

STFTの計算

  • librosa を使用してSTFTを計算できます。
  • 窓サイズなど、いくつかのパラメータを調整できます。
  • ここでは全周波数の平均値を正規化するデシベルに変換します。
  • その後、specshow() 関数で可視化できます。
Pythonで学ぶMachine Learningによる時系列データ解析

コードによるSTFTの計算

# Import the functions we'll use for the STFT
from librosa.core import stft, amplitude_to_db
from librosa.display import specshow
import matplotlib.pyplot as plt

# Calculate our STFT
HOP_LENGTH = 2**4
SIZE_WINDOW = 2**7
audio_spec = stft(audio, hop_length=HOP_LENGTH, n_fft=SIZE_WINDOW)

# Convert into decibels for visualization
spec_db = amplitude_to_db(audio_spec)

# Visualize
fig, ax = plt.subplots()
specshow(spec_db, sr=sfreq, x_axis='time', 
         y_axis='hz', hop_length=HOP_LENGTH, ax=ax)
Pythonで学ぶMachine Learningによる時系列データ解析

スペクトル特徴量エンジニアリング

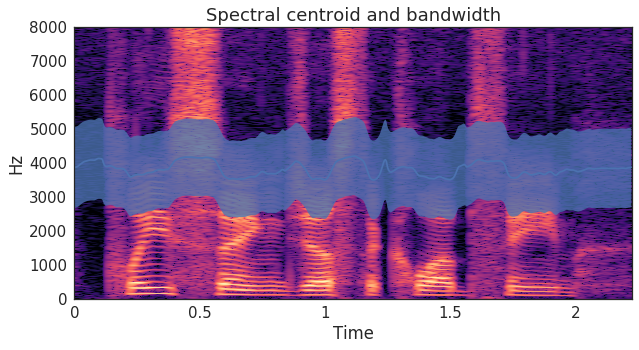
  • 各時系列には異なるスペクトルパターンがあります。
  • スペクトログラムを分析することでこれらのパターンを算出できます。
  • 例えば、スペクトル帯域幅スペクトル重心は各時点のエネルギー分布を表します。

Pythonで学ぶMachine Learningによる時系列データ解析

スペクトル特徴量の計算

# Calculate the spectral centroid and bandwidth for the spectrogram
bandwidths = lr.feature.spectral_bandwidth(S=spec)[0]
centroids = lr.feature.spectral_centroid(S=spec)[0]

# Display these features on top of the spectrogram
fig, ax = plt.subplots()
specshow(spec, x_axis='time', y_axis='hz', hop_length=HOP_LENGTH, ax=ax)
ax.plot(times_spec, centroids)
ax.fill_between(times_spec, centroids - bandwidths / 2, 
                centroids + bandwidths / 2, alpha=0.5)
Pythonで学ぶMachine Learningによる時系列データ解析

スペクトル特徴量と時間的特徴量を組み合わせた分類器

centroids_all = []
bandwidths_all = []
for spec in spectrograms:
    bandwidths = lr.feature.spectral_bandwidth(S=lr.db_to_amplitude(spec))
    centroids = lr.feature.spectral_centroid(S=lr.db_to_amplitude(spec))
    # Calculate the mean spectral bandwidth
    bandwidths_all.append(np.mean(bandwidths))  
    # Calculate the mean spectral centroid
    centroids_all.append(np.mean(centroids))  

# Create our X matrix
X = np.column_stack([means, stds, maxs, tempo_mean, 
                     tempo_max, tempo_std, bandwidths_all, centroids_all])
Pythonで学ぶMachine Learningによる時系列データ解析

練習しましょう!

Pythonで学ぶMachine Learningによる時系列データ解析

Preparing Video For Download...