時系列データのクロスバリデーション

Pythonで学ぶMachine Learningによる時系列データ解析

Chris Holdgraf

Fellow, Berkeley Institute for Data Science

scikit-learnによるクロスバリデーション

# Iterating over the "split" method yields train/test indices
for tr, tt in cv.split(X, y):
    model.fit(X[tr], y[tr])
    model.score(X[tt], y[tt])
Pythonで学ぶMachine Learningによる時系列データ解析

CVの種類:KFold

  • KFoldは等サイズの「分割」にデータを分けるCV手法です
  • 最も一般的なCVの一つです

      from sklearn.model_selection import KFold
      cv = KFold(n_splits=5)
      for tr, tt in cv.split(X, y):
          ...
    
Pythonで学ぶMachine Learningによる時系列データ解析

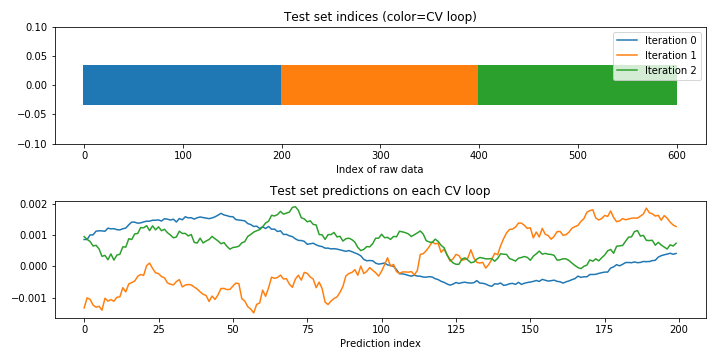
モデル予測の可視化

fig, axs = plt.subplots(2, 1)

# Plot the indices chosen for validation on each loop
axs[0].scatter(tt, [0] * len(tt), marker='_', s=2, lw=40)
axs[0].set(ylim=[-.1, .1], title='Test set indices (color=CV loop)', 
           xlabel='Index of raw data')

# Plot the model predictions on each iteration
axs[1].plot(model.predict(X[tt]))
axs[1].set(title='Test set predictions on each CV loop', 
           xlabel='Prediction index')
Pythonで学ぶMachine Learningによる時系列データ解析

KFold CVの動作の可視化

Pythonで学ぶMachine Learningによる時系列データ解析

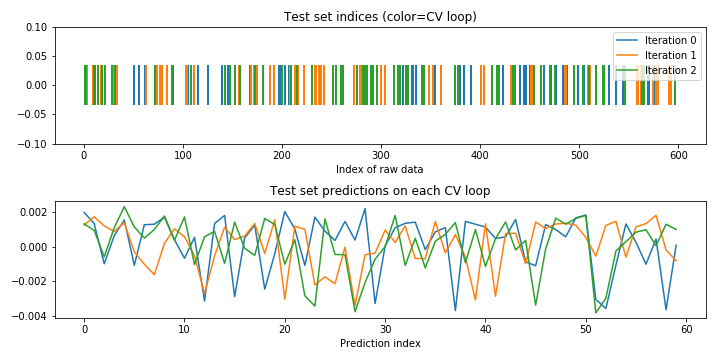
データのシャッフルに関する注意

  • 多くのCVイテレーターはデータのシャッフルをサポートしています
  • これはデータがi.i.d.の場合にのみ有効で、時系列データは通常そうではありません
  • 時系列データの予測では、シャッフルを使用すべきではありません

      from sklearn.model_selection import ShuffleSplit
    
      cv = ShuffleSplit(n_splits=3)
      for tr, tt in cv.split(X, y):
          ...
    
Pythonで学ぶMachine Learningによる時系列データ解析

シャッフルされたCVの動作の可視化

Pythonで学ぶMachine Learningによる時系列データ解析

時系列CVイテレーターの使用

  • これまでのCVでは時間の順序を無視していました
  • しかし、一般的に将来のデータを使って過去を予測すべきではありません
  • アプローチの一例:過去のデータで未来を予測する
Pythonで学ぶMachine Learningによる時系列データ解析

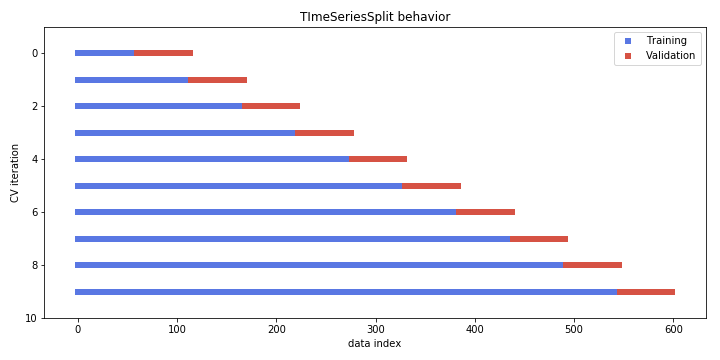
時系列CVイテレーターの可視化

# Import and initialize the cross-validation iterator
from sklearn.model_selection import TimeSeriesSplit
cv = TimeSeriesSplit(n_splits=10)

fig, ax = plt.subplots(figsize=(10, 5))
for ii, (tr, tt) in enumerate(cv.split(X, y)):
    # Plot training and test indices
    l1 = ax.scatter(tr, [ii] * len(tr), c=[plt.cm.coolwarm(.1)], 
                    marker='_', lw=6)
    l2 = ax.scatter(tt, [ii] * len(tt), c=[plt.cm.coolwarm(.9)], 
                    marker='_', lw=6)
    ax.set(ylim=[10, -1], title='TimeSeriesSplit behavior', 
           xlabel='data index', ylabel='CV iteration')
    ax.legend([l1, l2], ['Training', 'Validation'])
Pythonで学ぶMachine Learningによる時系列データ解析

TimeSeriesSplit CVイテレーターの可視化

Pythonで学ぶMachine Learningによる時系列データ解析

scikit-learnのカスタムスコアリング関数

def myfunction(estimator, X, y):
    y_pred = estimator.predict(X)
    my_custom_score = my_custom_function(y_pred, y)
    return my_custom_score
Pythonで学ぶMachine Learningによる時系列データ解析

scikit-learn用カスタム相関関数

def my_pearsonr(est, X, y):
    # Generate predictions and convert to a vector 
    y_pred = est.predict(X).squeeze()

    # Use the numpy "corrcoef" function to calculate a correlation matrix
    my_corrcoef_matrix = np.corrcoef(y_pred, y.squeeze())

    # Return a single correlation value from the matrix
    my_corrcoef = my_corrcoef[1, 0]
    return my_corrcoef
Pythonで学ぶMachine Learningによる時系列データ解析

練習しましょう!

Pythonで学ぶMachine Learningによる時系列データ解析

Preparing Video For Download...