定常性と安定性

Pythonで学ぶMachine Learningによる時系列データ解析

Chris Holdgraf

Fellow, Berkeley Institute for Data Science
定常性

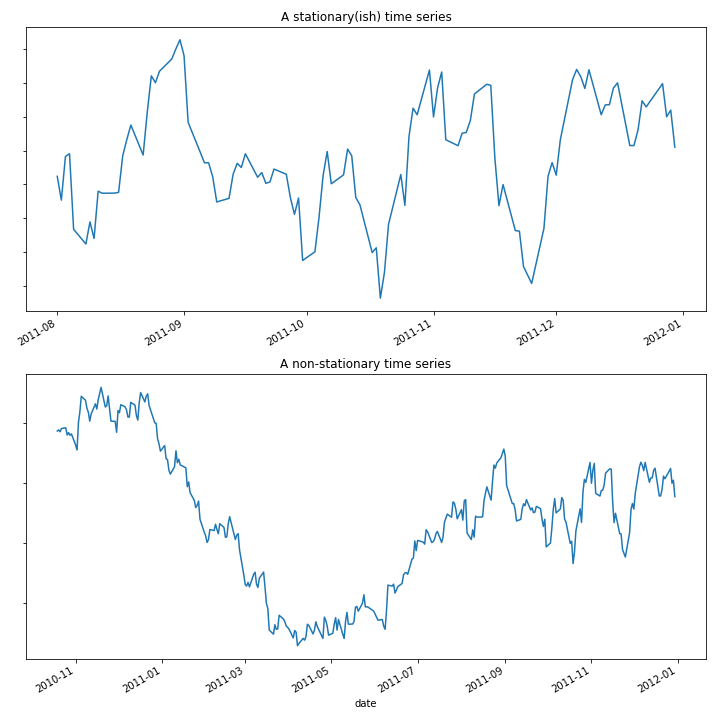
  • 定常時系列は統計的性質が時間によって変化しない
  • 例:平均、標準偏差、トレンド
  • 多くの時系列はある程度非定常である
Pythonで学ぶMachine Learningによる時系列データ解析

Pythonで学ぶMachine Learningによる時系列データ解析

モデルの安定性

  • 非定常データはモデルにばらつきをもたらす
  • モデルが捉える統計的性質がデータとともに変化する可能性がある
  • モデルパラメータの適切な値に対する確信度も低下する
  • これをどのように定量化するか?
Pythonで学ぶMachine Learningによる時系列データ解析

パラメータ安定性の定量化のための交差検証

  • アプローチの一つ:交差検証の使用
  • 各イテレーションでモデルパラメータを計算
  • すべてのCVスプリットにわたるパラメータの安定性を評価
Pythonで学ぶMachine Learningによる時系列データ解析

平均のブートストラップ

  • ブートストラップはばらつきを評価する一般的な手法
  • ブートストラップの手順:
    1. 復元抽出でデータのランダムサンプルを取得
    2. サンプルの平均を計算
    3. このプロセスを多数回繰り返す(1000回以上)
    4. 結果のパーセンタイルを計算(通常は2.5、97.5)

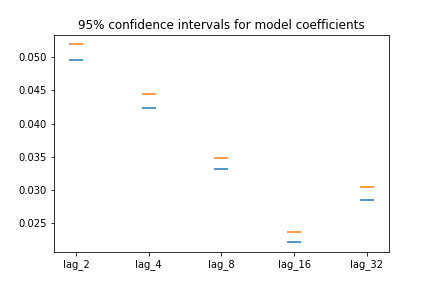
結果は各係数の平均の95%信頼区間となる。

Pythonで学ぶMachine Learningによる時系列データ解析

平均のブートストラップ

from sklearn.utils import resample

# cv_coefficients has shape (n_cv_folds, n_coefficients)
n_boots = 100
bootstrap_means = np.zeros(n_boots, n_coefficients)
for ii in range(n_boots):
    # Generate random indices for our data with replacement, 
    # then take the sample mean
    random_sample = resample(cv_coefficients)
    bootstrap_means[ii] = random_sample.mean(axis=0)

# Compute the percentiles of choice for the bootstrapped means
percentiles = np.percentile(bootstrap_means, (2.5, 97.5), axis=0)
Pythonで学ぶMachine Learningによる時系列データ解析

ブートストラップ係数のプロット

fig, ax = plt.subplots()
ax.scatter(many_shifts.columns, percentiles[0], marker='_', s=200)
ax.scatter(many_shifts.columns, percentiles[1], marker='_', s=200)
Pythonで学ぶMachine Learningによる時系列データ解析

モデル性能の安定性評価

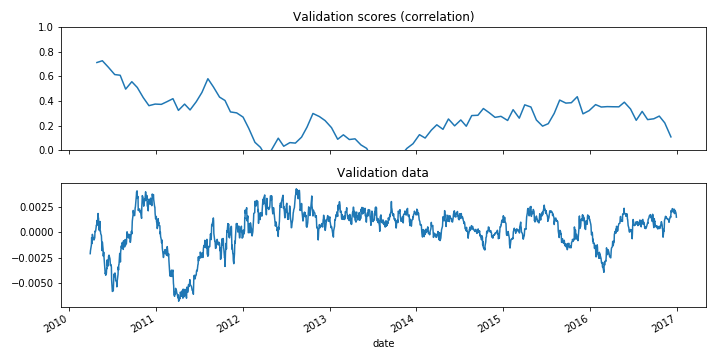
  • TimeSeriesSplit を使用する場合、モデルのスコアを時系列でプロット可能
  • スコアに悪影響を与える時間帯の特定に有用
  • 非定常シグナルの検出にも役立つ
Pythonで学ぶMachine Learningによる時系列データ解析

時系列でのモデル性能

def my_corrcoef(est, X, y):
    """Return the correlation coefficient 
    between model predictions and a validation set."""
    return np.corrcoef(y, est.predict(X))[1, 0]

# Grab the date of the first index of each validation set
first_indices = [data.index[tt[0]] for tr, tt in cv.split(X, y)]

# Calculate the CV scores and convert to a Pandas Series
cv_scores = cross_val_score(model, X, y, cv=cv, scoring=my_corrcoef)
cv_scores = pd.Series(cv_scores, index=first_indices)
Pythonで学ぶMachine Learningによる時系列データ解析

モデルスコアの時系列可視化

fig, axs = plt.subplots(2, 1, figsize=(10, 5), sharex=True)

# Calculate a rolling mean of scores over time
cv_scores_mean = cv_scores.rolling(10, min_periods=1).mean()
cv_scores.plot(ax=axs[0])
axs[0].set(title='Validation scores (correlation)', ylim=[0, 1])

# Plot the raw data
data.plot(ax=axs[1])
axs[1].set(title='Validation data')
Pythonで学ぶMachine Learningによる時系列データ解析

モデルスコアの可視化

Pythonで学ぶMachine Learningによる時系列データ解析

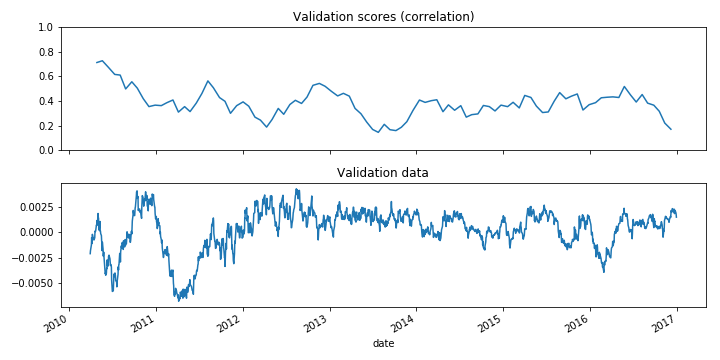
時系列交差検証での固定ウィンドウ

# Only keep the last 100 datapoints in the training data
window = 100

# Initialize the CV with this window size
cv = TimeSeriesSplit(n_splits=10, max_train_size=window)
Pythonで学ぶMachine Learningによる時系列データ解析

非定常シグナル

Pythonで学ぶMachine Learningによる時系列データ解析

練習しましょう!

Pythonで学ぶMachine Learningによる時系列データ解析

Preparing Video For Download...