時間遅延特徴量と自己回帰モデル

Pythonで学ぶMachine Learningによる時系列データ解析

Chris Holdgraf

Fellow, Berkeley Institute for Data Science

過去の情報の有用性

  • 時系列データには、時点間で共有される情報がほぼ必ず存在します
  • 過去の情報は未来の予測に役立ちます
  • 時系列の予測に最も適した特徴量は、多くの場合その時系列の過去の値です
Pythonで学ぶMachine Learningによる時系列データ解析

滑らかさと自己相関について

  • 時系列に対してよく問われること:データはどの程度滑らかか
  • つまり、時点が隣接する時点とどの程度相関しているか(自己相関
  • データの自己相関の強さはモデルに影響を与えます
Pythonで学ぶMachine Learningによる時系列データ解析

時間ラグ特徴量の作成

  • 過去の値を入力特徴量として使用するモデルを構築する方法を見ていきます
  • 信号の自己相関の程度(およびその他の情報)を評価するために活用できます
Pythonで学ぶMachine Learningによる時系列データ解析

Pandasによるデータの時間シフト

print(df)
         df 
    0   0.0
    1   1.0 
    2   2.0 
    3   3.0 
    4   4.0 
# Shift a DataFrame/Series by 3 index values towards the past
print(df.shift(3))
         df
    0   NaN
    1   NaN
    2   NaN
    3   0.0
    4   1.0
Pythonで学ぶMachine Learningによる時系列データ解析

時間シフトDataFrameの作成

# data is a pandas Series containing time series data
data = pd.Series(...)

# Shifts
shifts = [0, 1, 2, 3, 4, 5, 6, 7]

# Create a dictionary of time-shifted data
many_shifts = {'lag_{}'.format(ii): data.shift(ii) for ii in shifts}

# Convert them into a dataframe
many_shifts = pd.DataFrame(many_shifts)
Pythonで学ぶMachine Learningによる時系列データ解析

時間シフト特徴量を用いたモデルの学習

# Fit the model using these input features 
model = Ridge() 
model.fit(many_shifts, data)
Pythonで学ぶMachine Learningによる時系列データ解析

自己回帰モデルの係数の解釈

# Visualize the fit model coefficients
fig, ax = plt.subplots()
ax.bar(many_shifts.columns, model.coef_)
ax.set(xlabel='Coefficient name', ylabel='Coefficient value')

# Set formatting so it looks nice
plt.setp(ax.get_xticklabels(), rotation=45, horizontalalignment='right')
Pythonで学ぶMachine Learningによる時系列データ解析

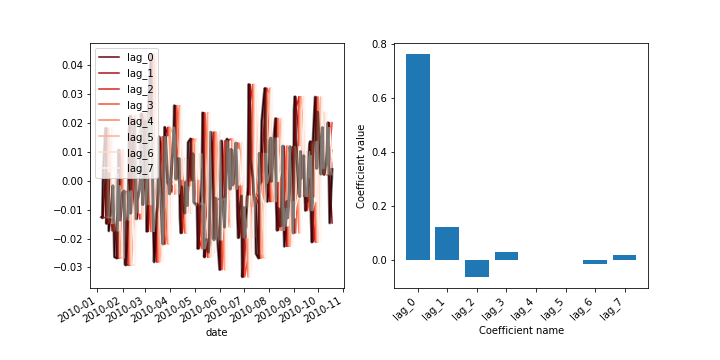
粗い信号の係数の可視化

Pythonで学ぶMachine Learningによる時系列データ解析

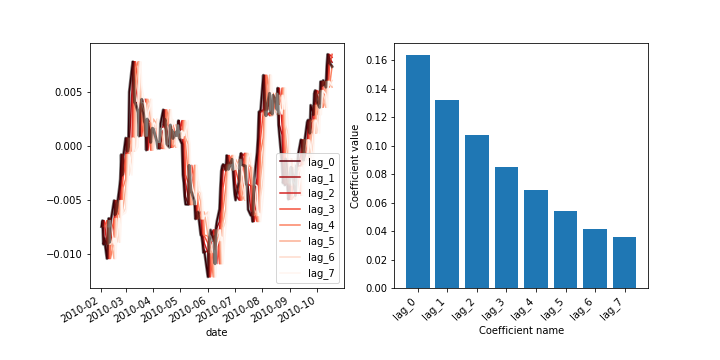
滑らかな信号の係数の可視化

Pythonで学ぶMachine Learningによる時系列データ解析

練習しましょう!

Pythonで学ぶMachine Learningによる時系列データ解析

Preparing Video For Download...