statsmodels を使った中級 Regression
Maarten Van den Broeck
Content Developer at DataCamp
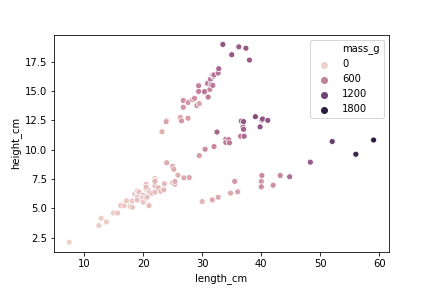
sns.scatterplot(x="length_cm",
                y="height_cm",
                data=fish,
                hue="mass_g")
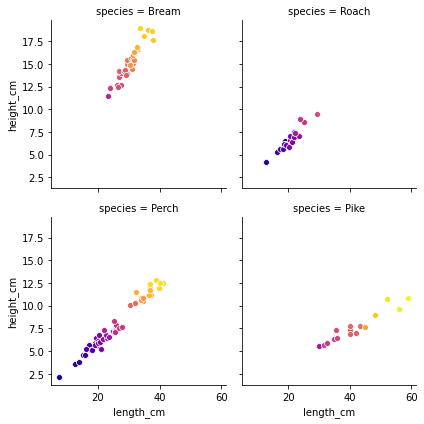
grid = sns.FacetGrid(data=fish,

                     col="species",

                     hue="mass_g",
                     col_wrap=2,

                     palette="plasma")
grid = sns.FacetGrid(data=fish,
col="species",
hue="mass_g", col_wrap=2,
palette="plasma")
grid.map(sns.scatterplot,
         "length_cm",
         "height_cm")
plt.show()
交互作用なし
ols("mass_g ~ length_cm + height_cm + species + 0", data=fish).fit()
2変数間の2次の交互作用
ols(
  "mass_g ~ length_cm + height_cm + species +
  length_cm:height_cm + length_cm:species + height_cm:species + 0", data=fish).fit()
3変数すべての3次の交互作用
ols(
  "mass_g ~ length_cm + height_cm + species +
  length_cm:height_cm + length_cm:species + height_cm:species + length_cm:height_cm:species + 0", data=fish).fit()
次と同じです
ols(
  "mass_g ~ length_cm * height_cm * species + 0",
  data=fish).fit()
ols(
  "mass_g ~ (length_cm + height_cm + species) ** 2 + 0",
  data=fish).fit()
mdl_mass_vs_all = ols(
  "mass_g ~ length_cm * height_cm * species + 0",
  data=fish).fit()

length_cm = np.arange(5, 61, 5)
height_cm = np.arange(2, 21, 2)
species = fish["species"].unique()

p = product(length_cm, height_cm, species)

explanatory_data = pd.DataFrame(p,
                                columns=["length_cm",
                                         "height_cm",
                                         "species"])

prediction_data = explanatory_data.assign(
  mass_g = mdl_mass_vs_all.predict(explanatory_data))

print(prediction_data)
     length_cm  height_cm species       mass_g
0            5          2   Bream  -570.656437
1            5          2   Roach    31.449145
2            5          2   Perch    43.789984
3            5          2    Pike   271.270093
4            5          4   Bream  -451.127405
..         ...        ...     ...          ...
475         60         18    Pike  2690.346384
476         60         20   Bream  1531.618475
477         60         20   Roach  2621.797668
478         60         20   Perch  3041.931709
479         60         20    Pike  2926.352397

[480 rows x 4 columns]