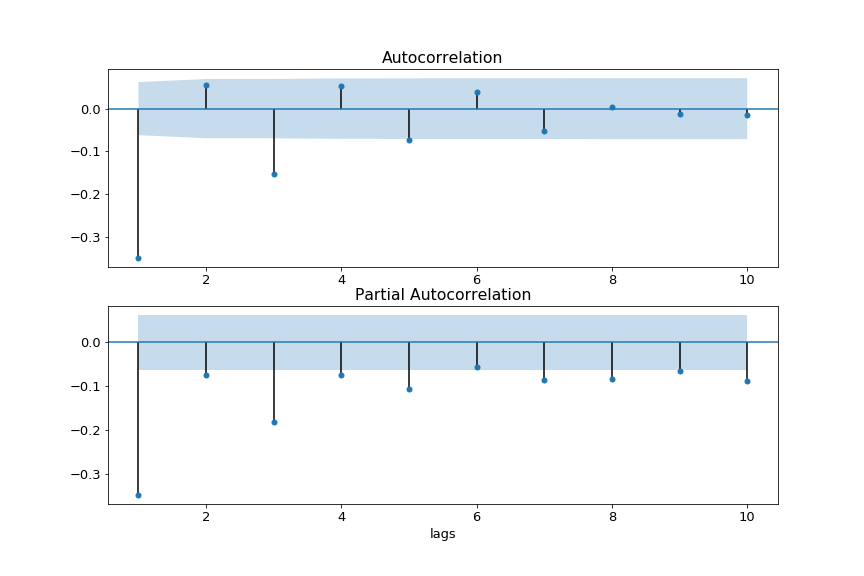
ACF と PACF の導入
Pythonで学ぶARIMAモデル

James Fulton
Climate informatics researcher
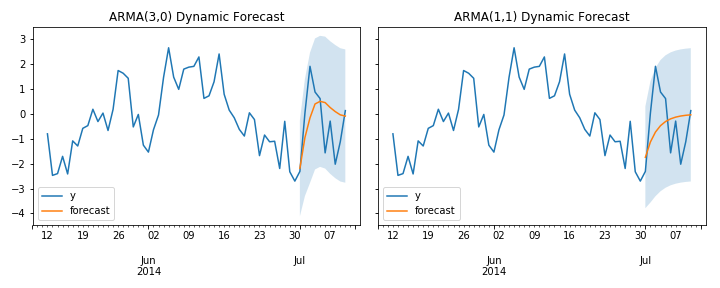
動機づけ
ACF とは
PACF とは
ACF と PACF で次数を選ぶ
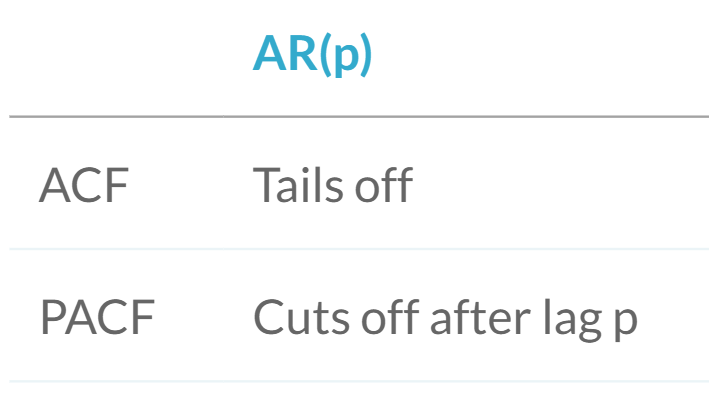
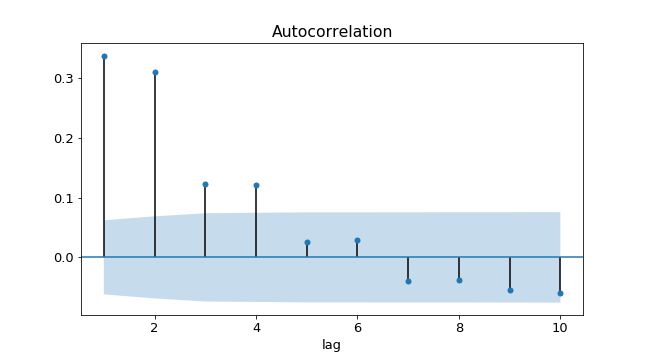
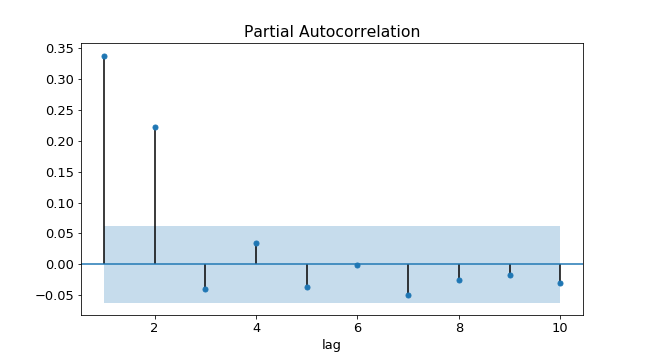
- AR(2) モデル $\rightarrow$
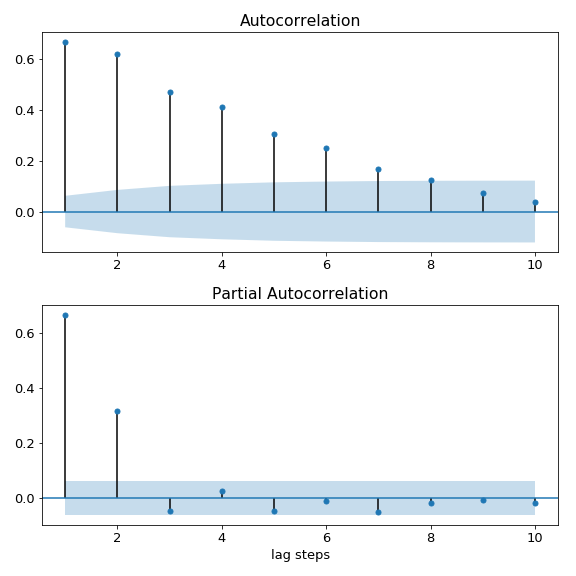
ACF と PACF で次数を選ぶ
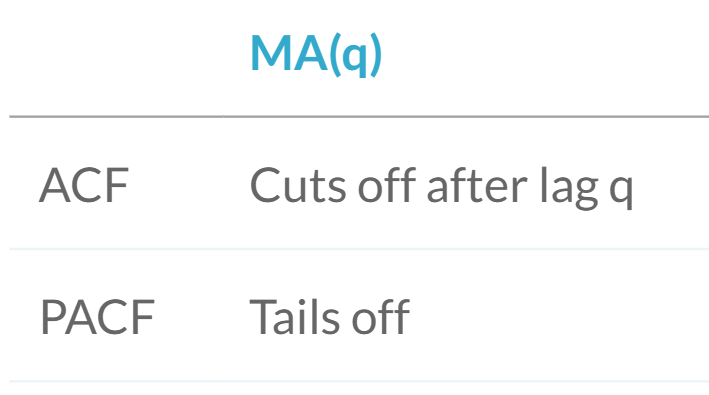
- MA(2) モデル $\rightarrow$
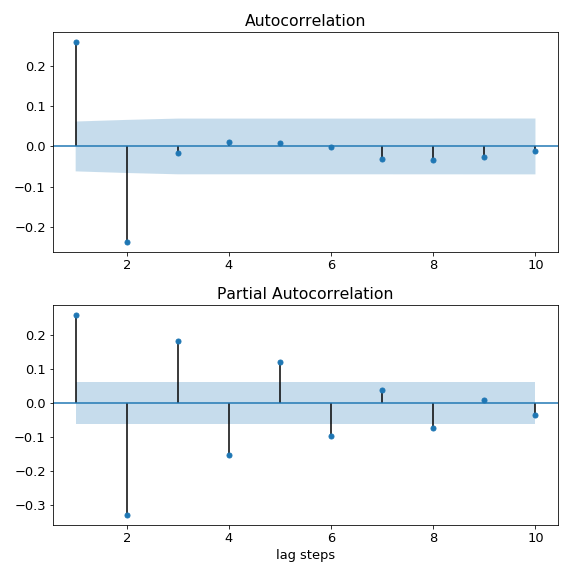
ACF と PACF で次数を選ぶ
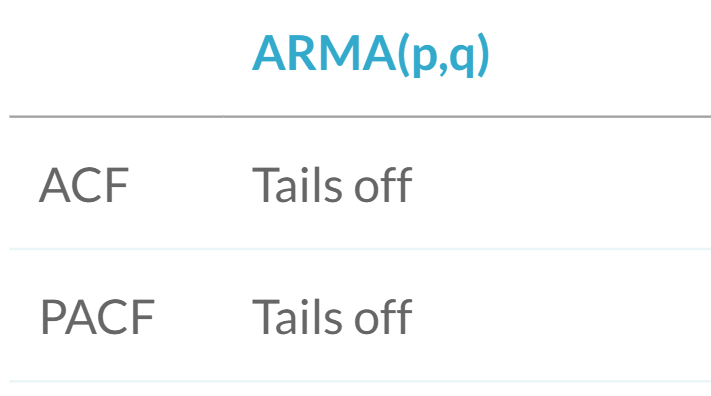
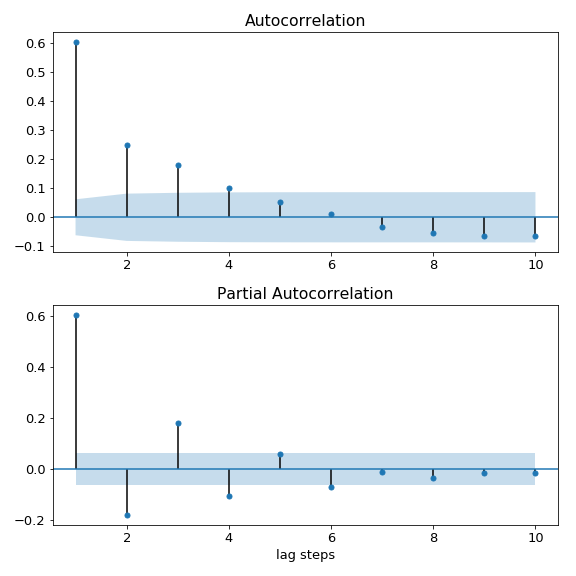
ACF と PACF で次数を選ぶ
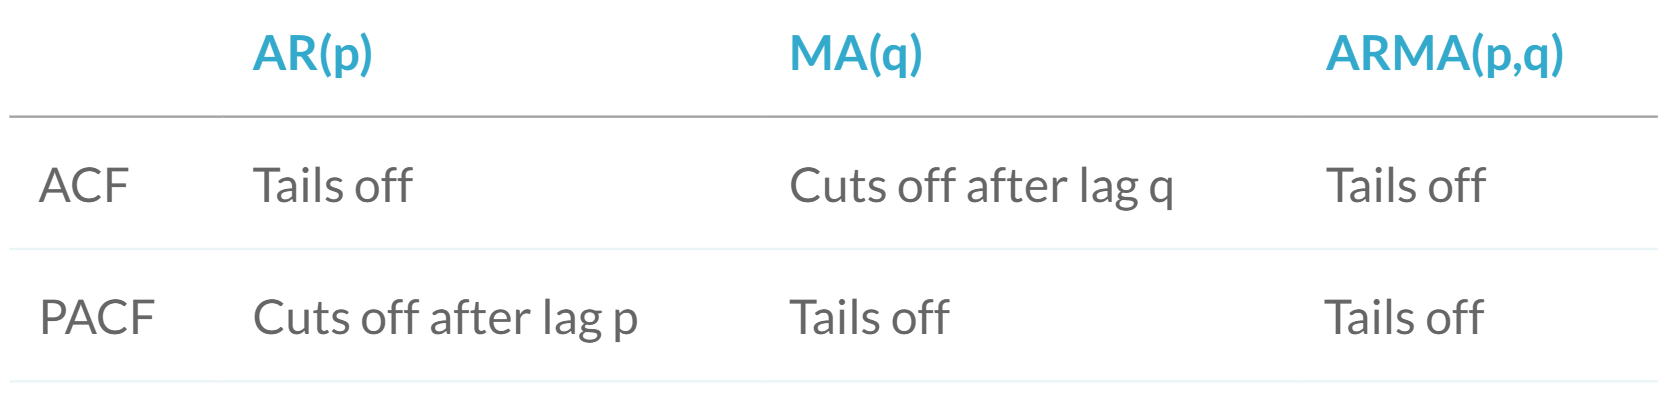
Python での実装
過少/過剰差分と ACF・PACF
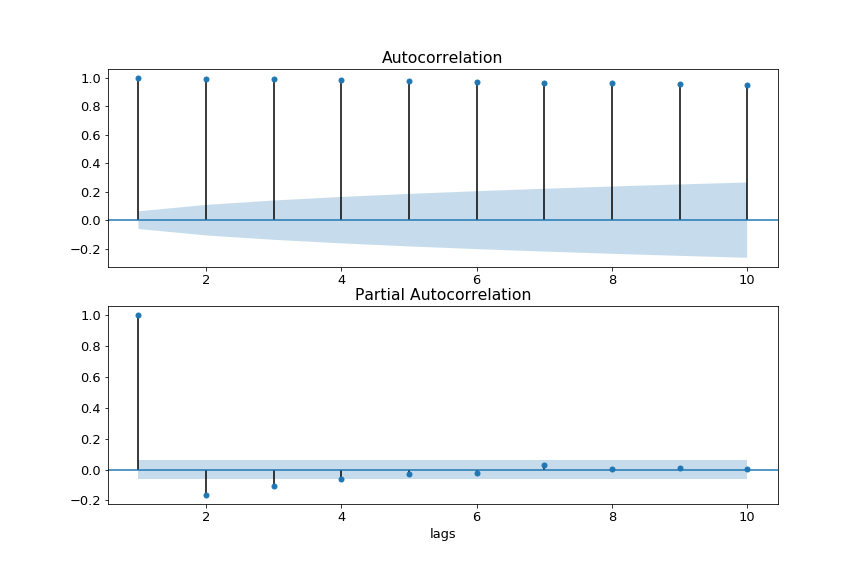
過少/過剰差分と ACF・PACF