変化を強調するカスタムプロット

Tidyverseによるデータコミュニケーション

Timo Grossenbacher

Data Journalist
Tidyverseによるデータコミュニケーション

ドットプロット

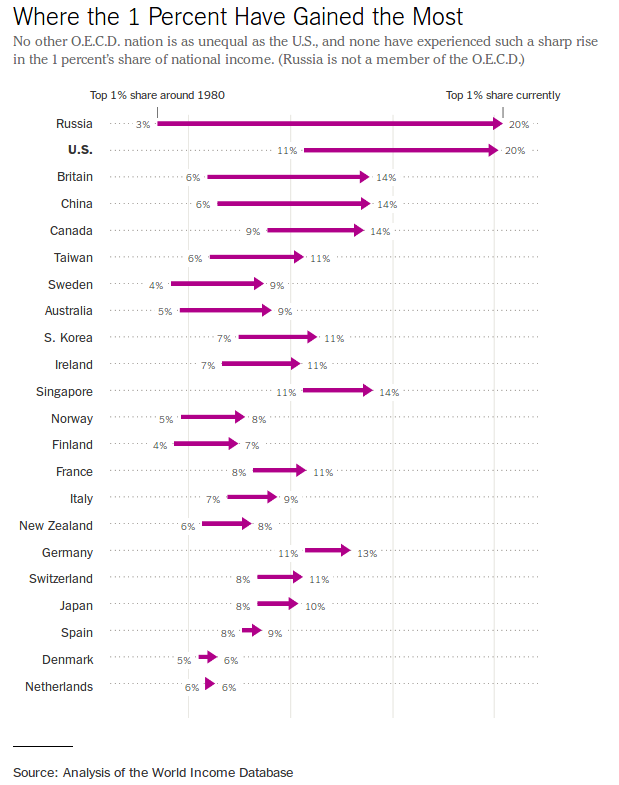
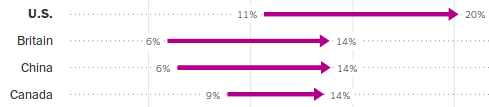
1 New York Times (https://www.nytimes.com/2017/11/17/upshot/income-inequality-united-states.html){{0}}
Tidyverseによるデータコミュニケーション

ggplot2でドットプロットを作成する

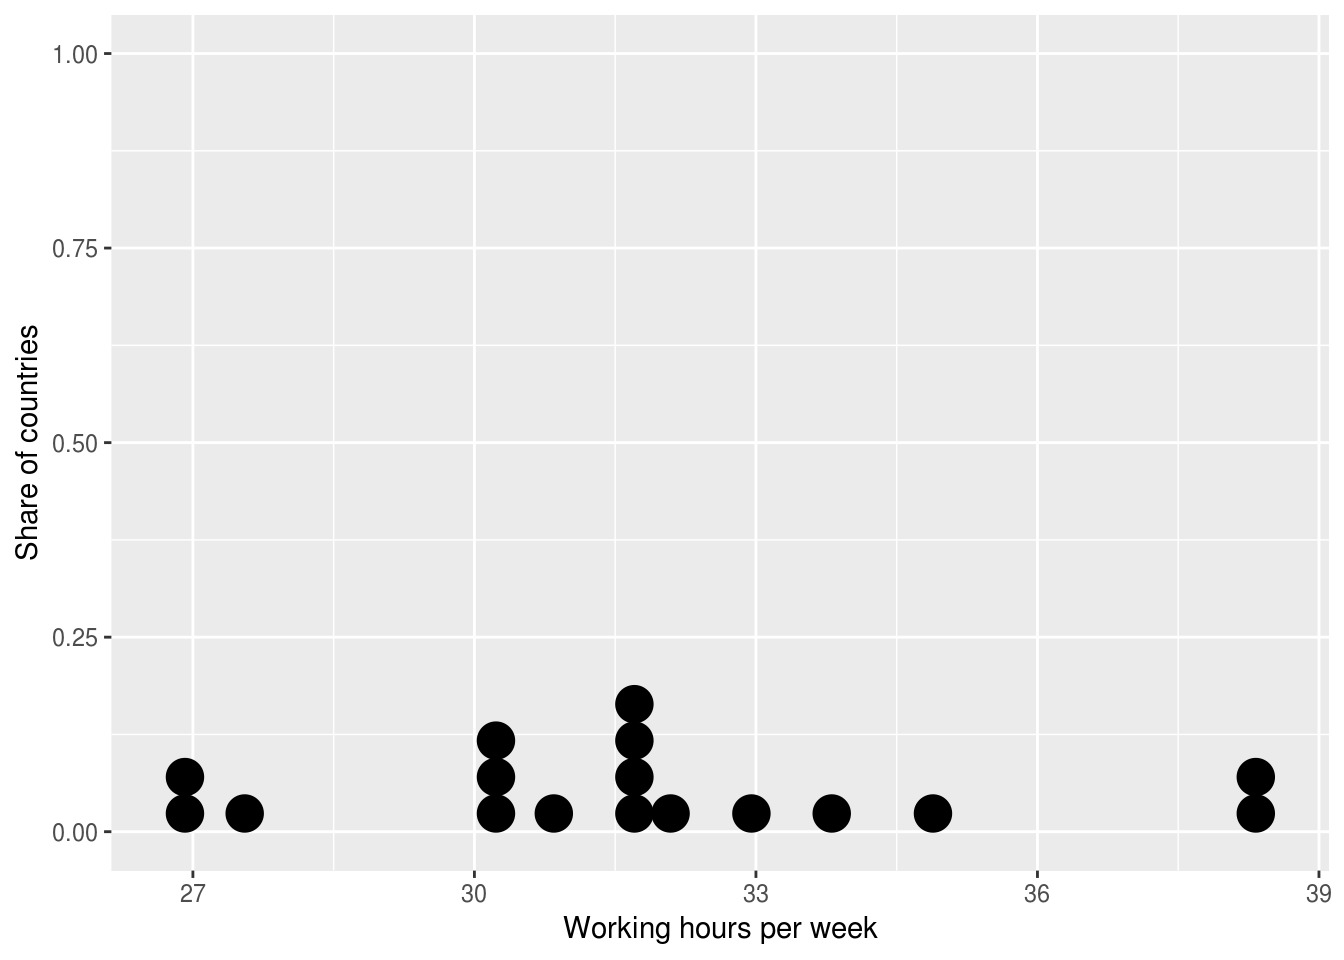
ggplot((ilo_data %>% filter(year == 2006))) +
  geom_dotplot(aes(x = working_hours)) +
  labs(x = "Working hours per week",
       y = "Share of countries")
Tidyverseによるデータコミュニケーション

`geom_path()`関数

?geom_path

geom_path() はデータに現れる順序で観測値を結びます。

ilo_data %>% 
    arrange(country)
# A tibble: 34 x 4
     country   year hourly_compensation working_hours
       <fct>  <fct>               <dbl>         <dbl>
1    Austria   1996               24.75      31.99808
2    Austria   2006               30.46      31.81731
3    Belgium   1996               25.25      31.65385
4    Belgium   2006               31.85      30.21154
5 Czech Rep.   1996                2.94      39.72692
# ... with 29 more rows
Tidyverseによるデータコミュニケーション

`ggplot2`のドットプロット:`geom_path()`関数

ggplot() +
    geom_path(aes(x = numeric_variable, y = numeric_variable))
ggplot() +
    geom_path(aes(x = numeric_variable, y = factor_variable))
ggplot() +
    geom_path(aes(x = numeric_variable, y = factor_variable),
                arrow = arrow(___))
Tidyverseによるデータコミュニケーション

geom_path()を試してみましょう!

Tidyverseによるデータコミュニケーション

Preparing Video For Download...