Tidyverseによるデータコミュニケーション
Timo Grossenbacher
Data Journalist
ggplot2
ilo_data$country
Austria        Belgium        Czech Rep.     Finland
France         Germany        Hungary    ...
 ...
 17 Levels: Austria Belgium Czech Rep. Finland France ... United Kingdom
library(forcats)
fct_drop
fct_rev
fct_reorder
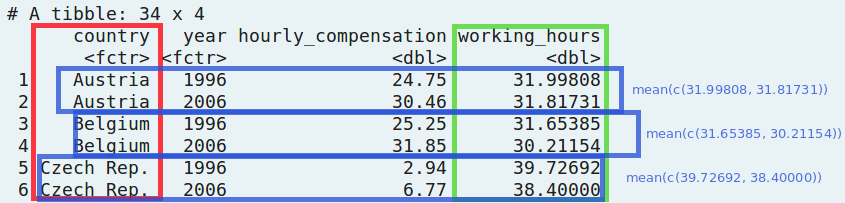
ilo_data
# A tibble: 34 x 4
      country   year hourly_compensation working_hours
        <fct>  <fct>               <dbl>         <dbl>
 1    Austria   1996               24.75      31.99808
 2    Austria   2006               30.46      31.81731
 3    Belgium   1996               25.25      31.65385
 4    Belgium   2006               31.85      30.21154
ilo_data <- ilo_data  %>%
    mutate(country = fct_reorder(country, working_hours, mean))
ilo_data$country
17 Levels: Netherlands Norway Germany Sweden ... Czech Rep.
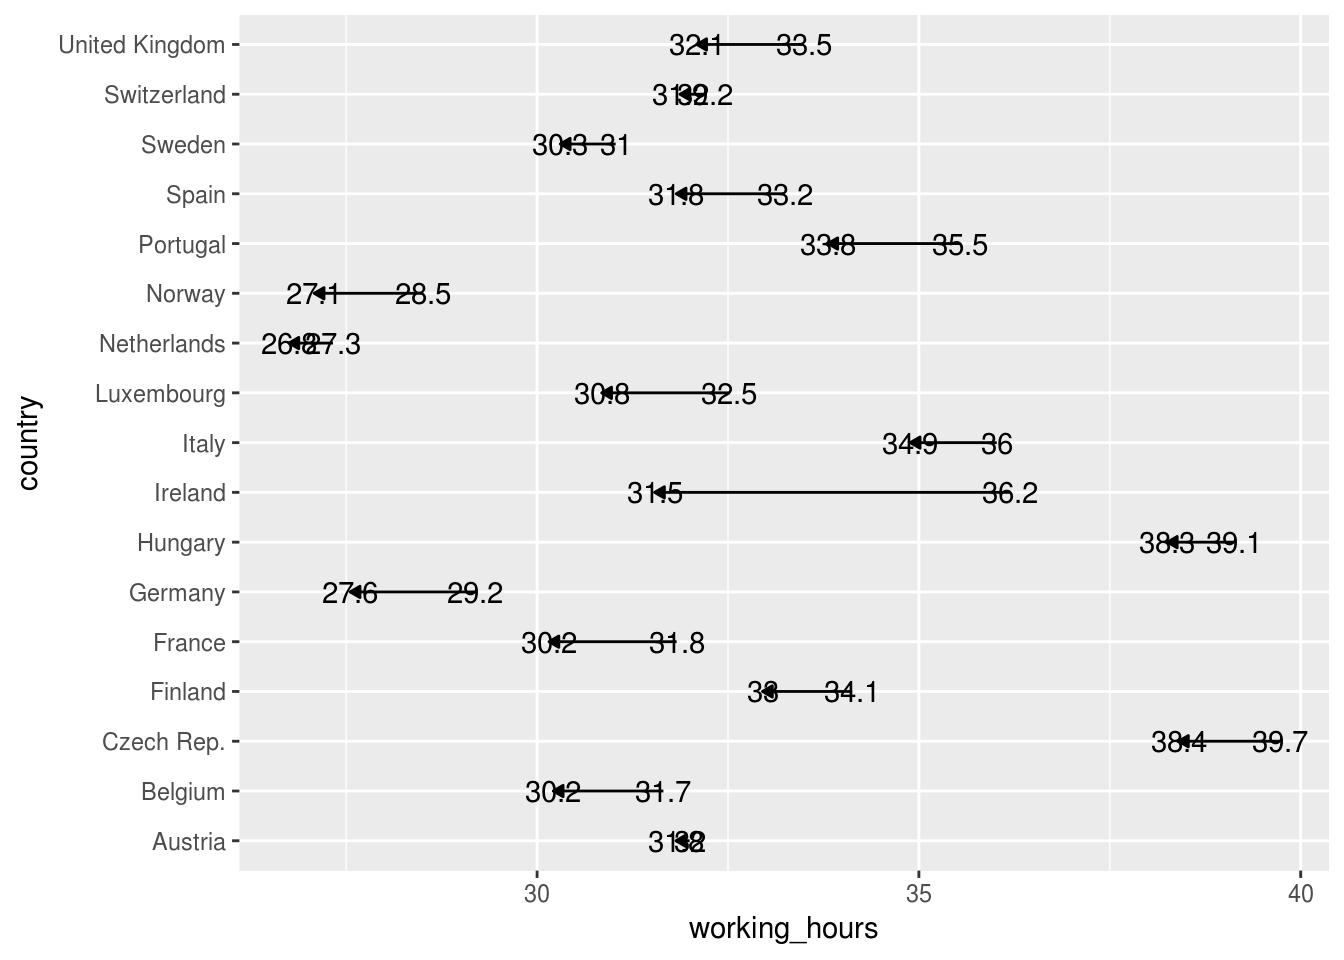
ggplot(ilo_data) +
  geom_path(aes(...)) +
  geom_text(
        aes(...,
            hjust = ifelse(year == "2006",
              1.4,
              -0.4)
        )
    )