Machine Learning with PySpark
Andrew Collier
Data Scientist, Fathom Data


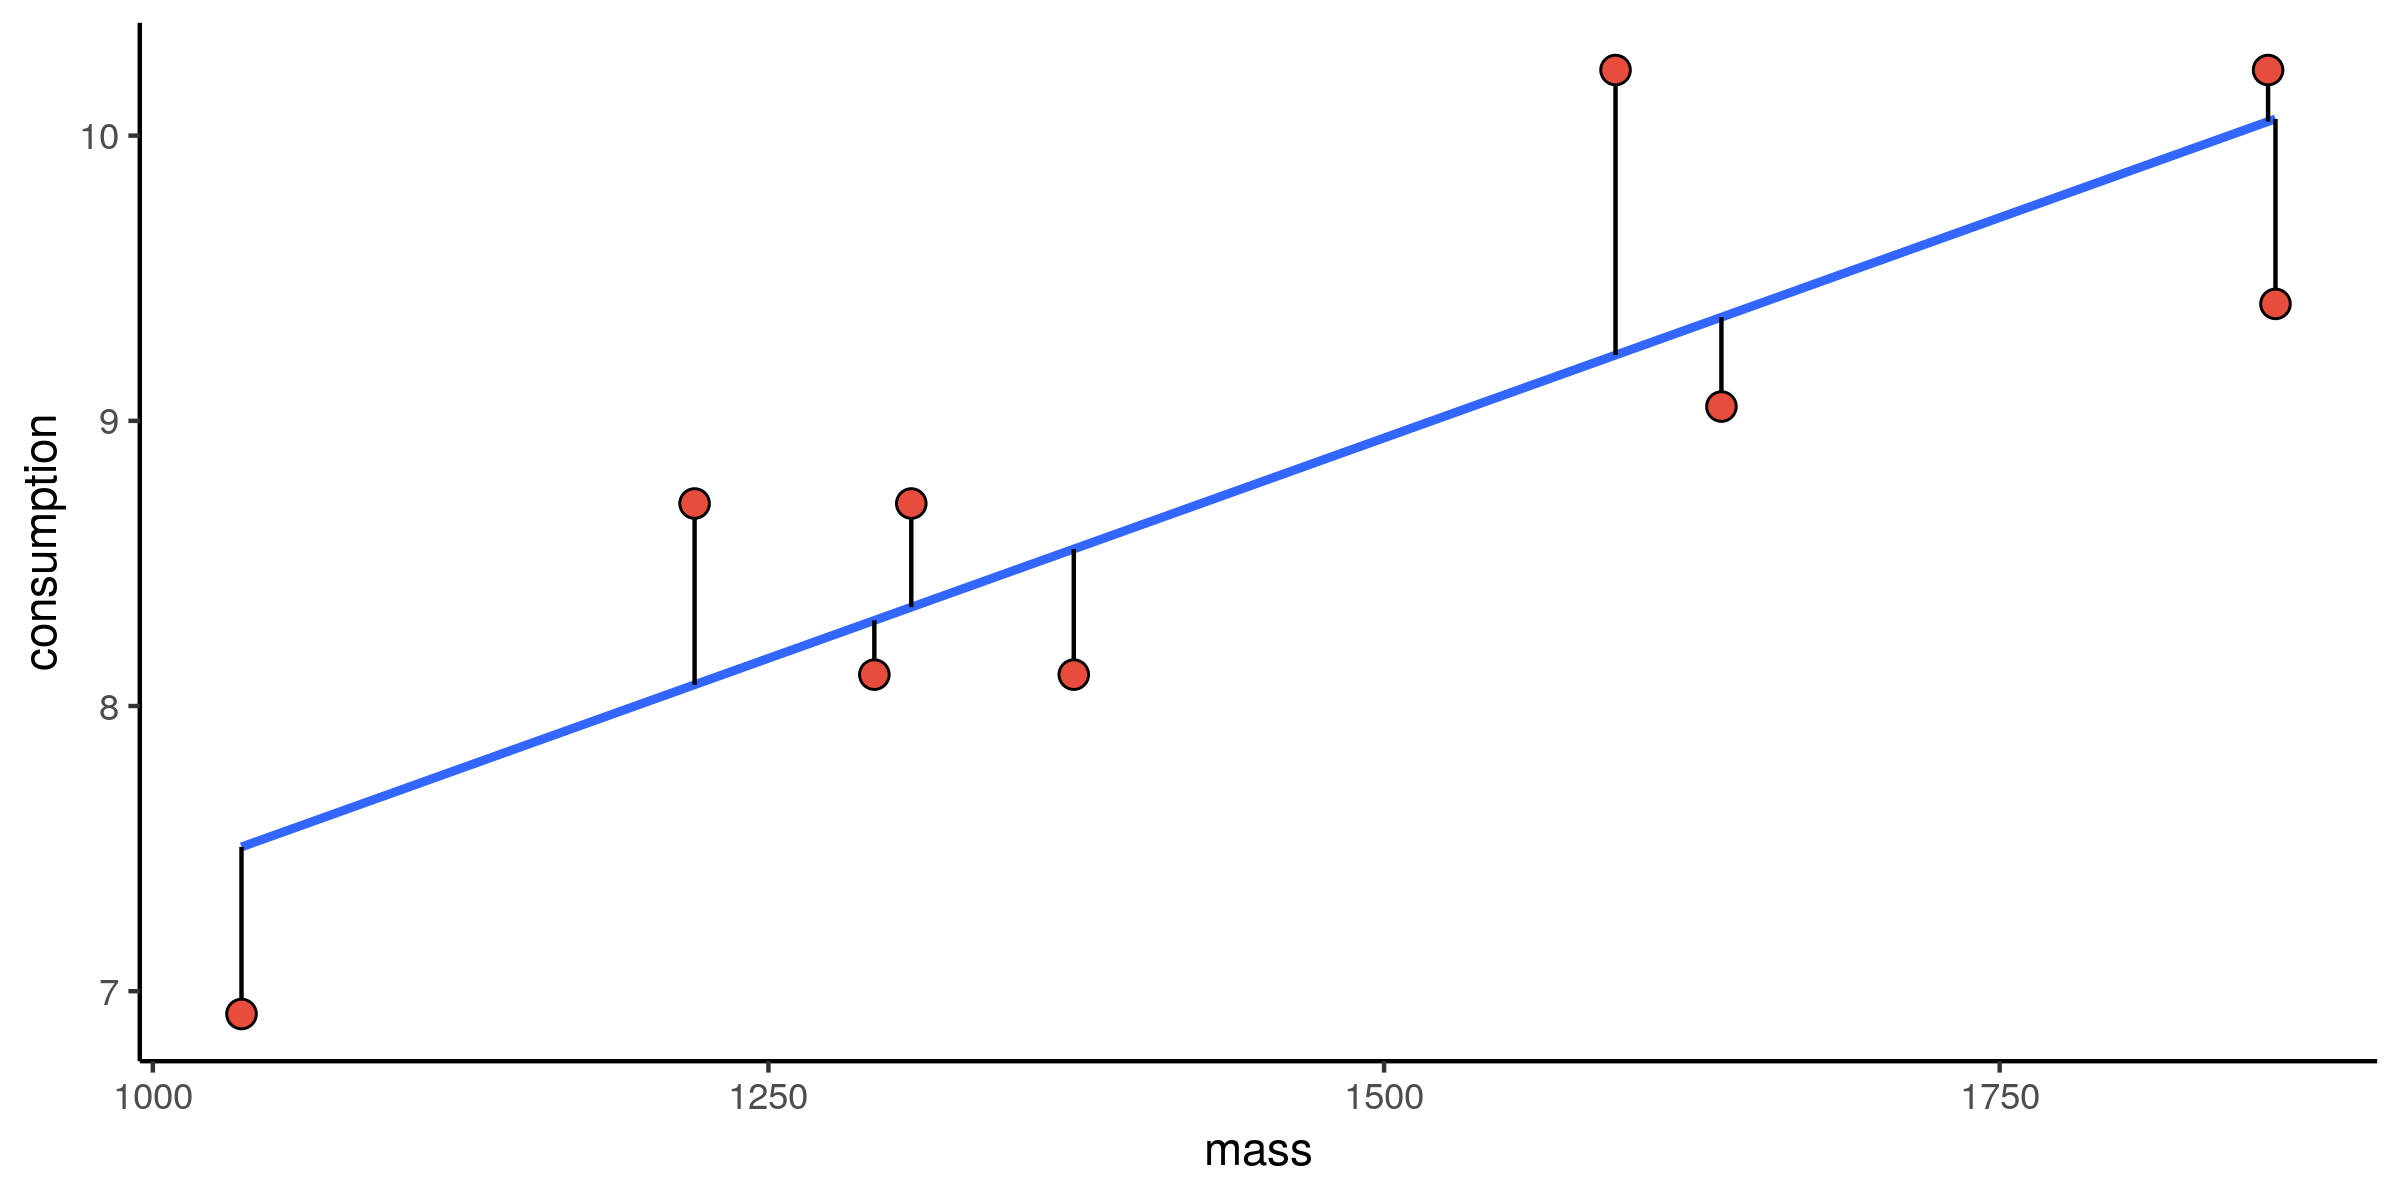
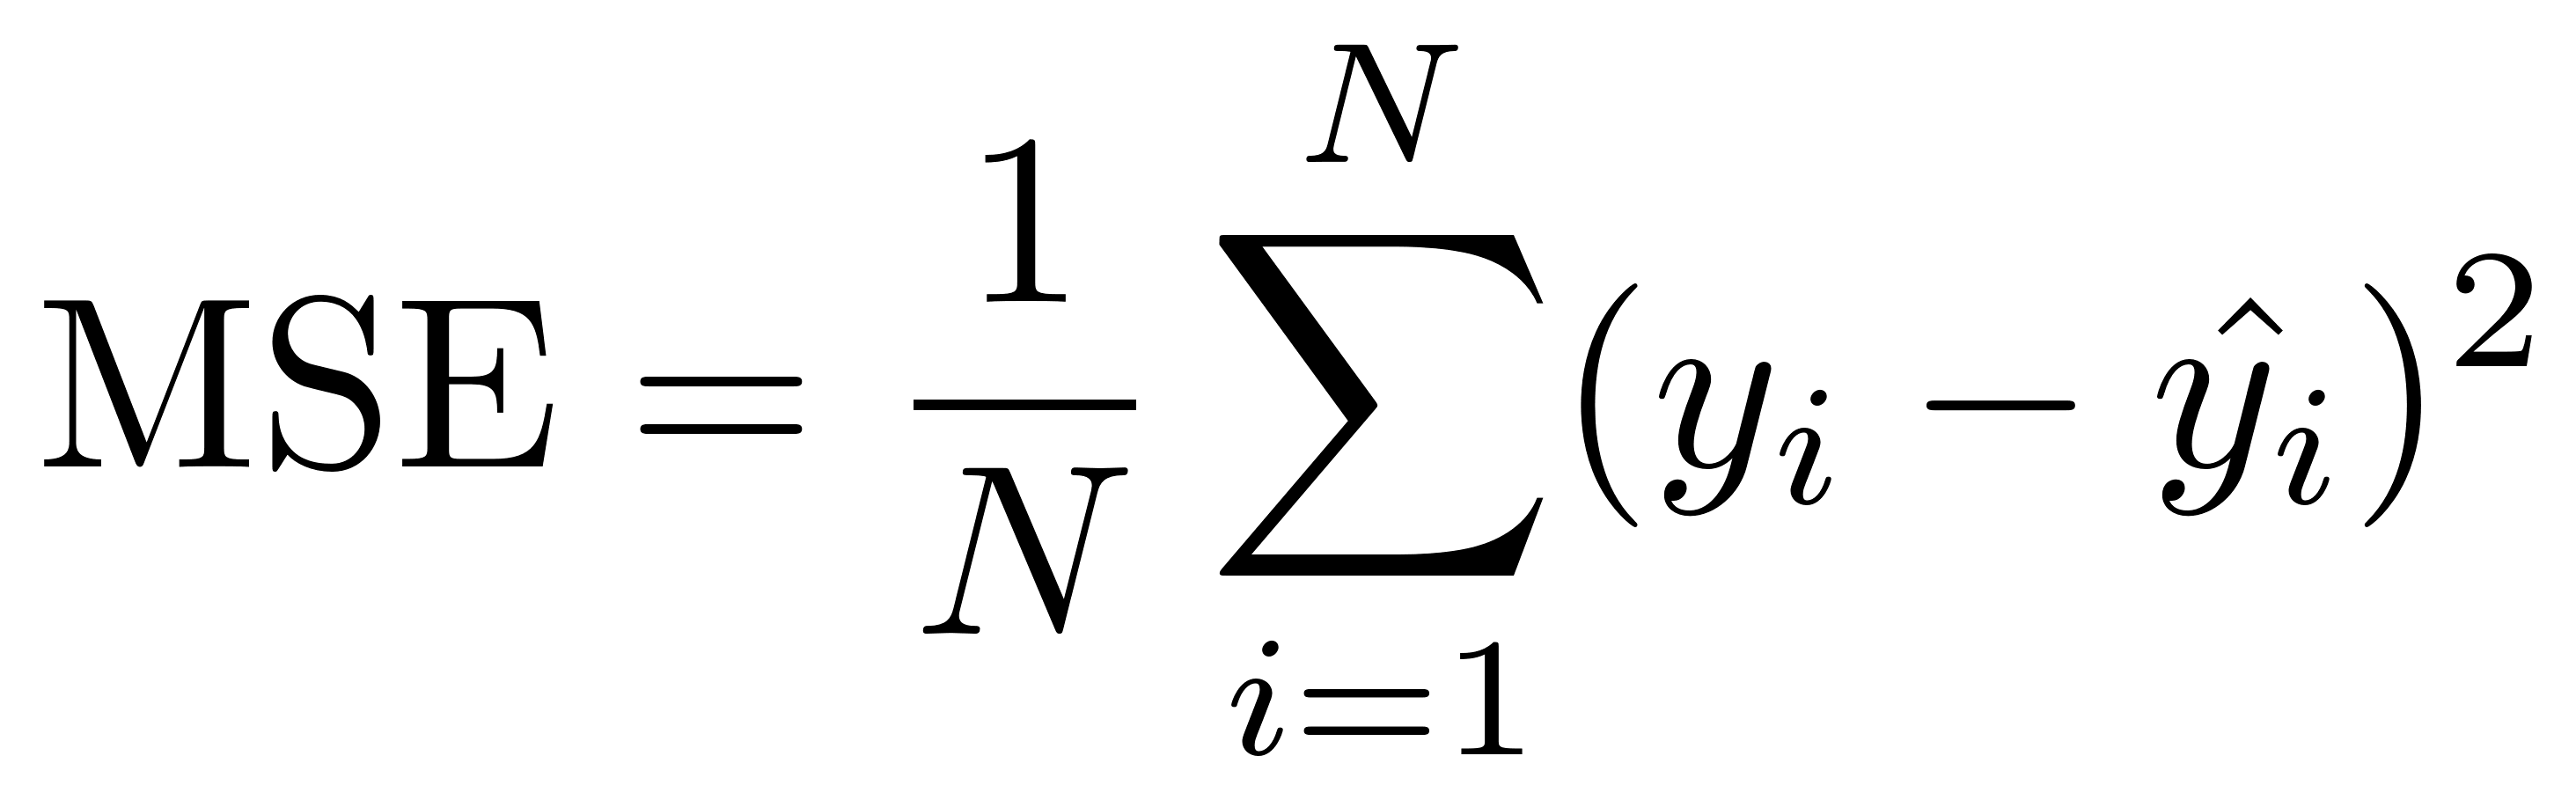
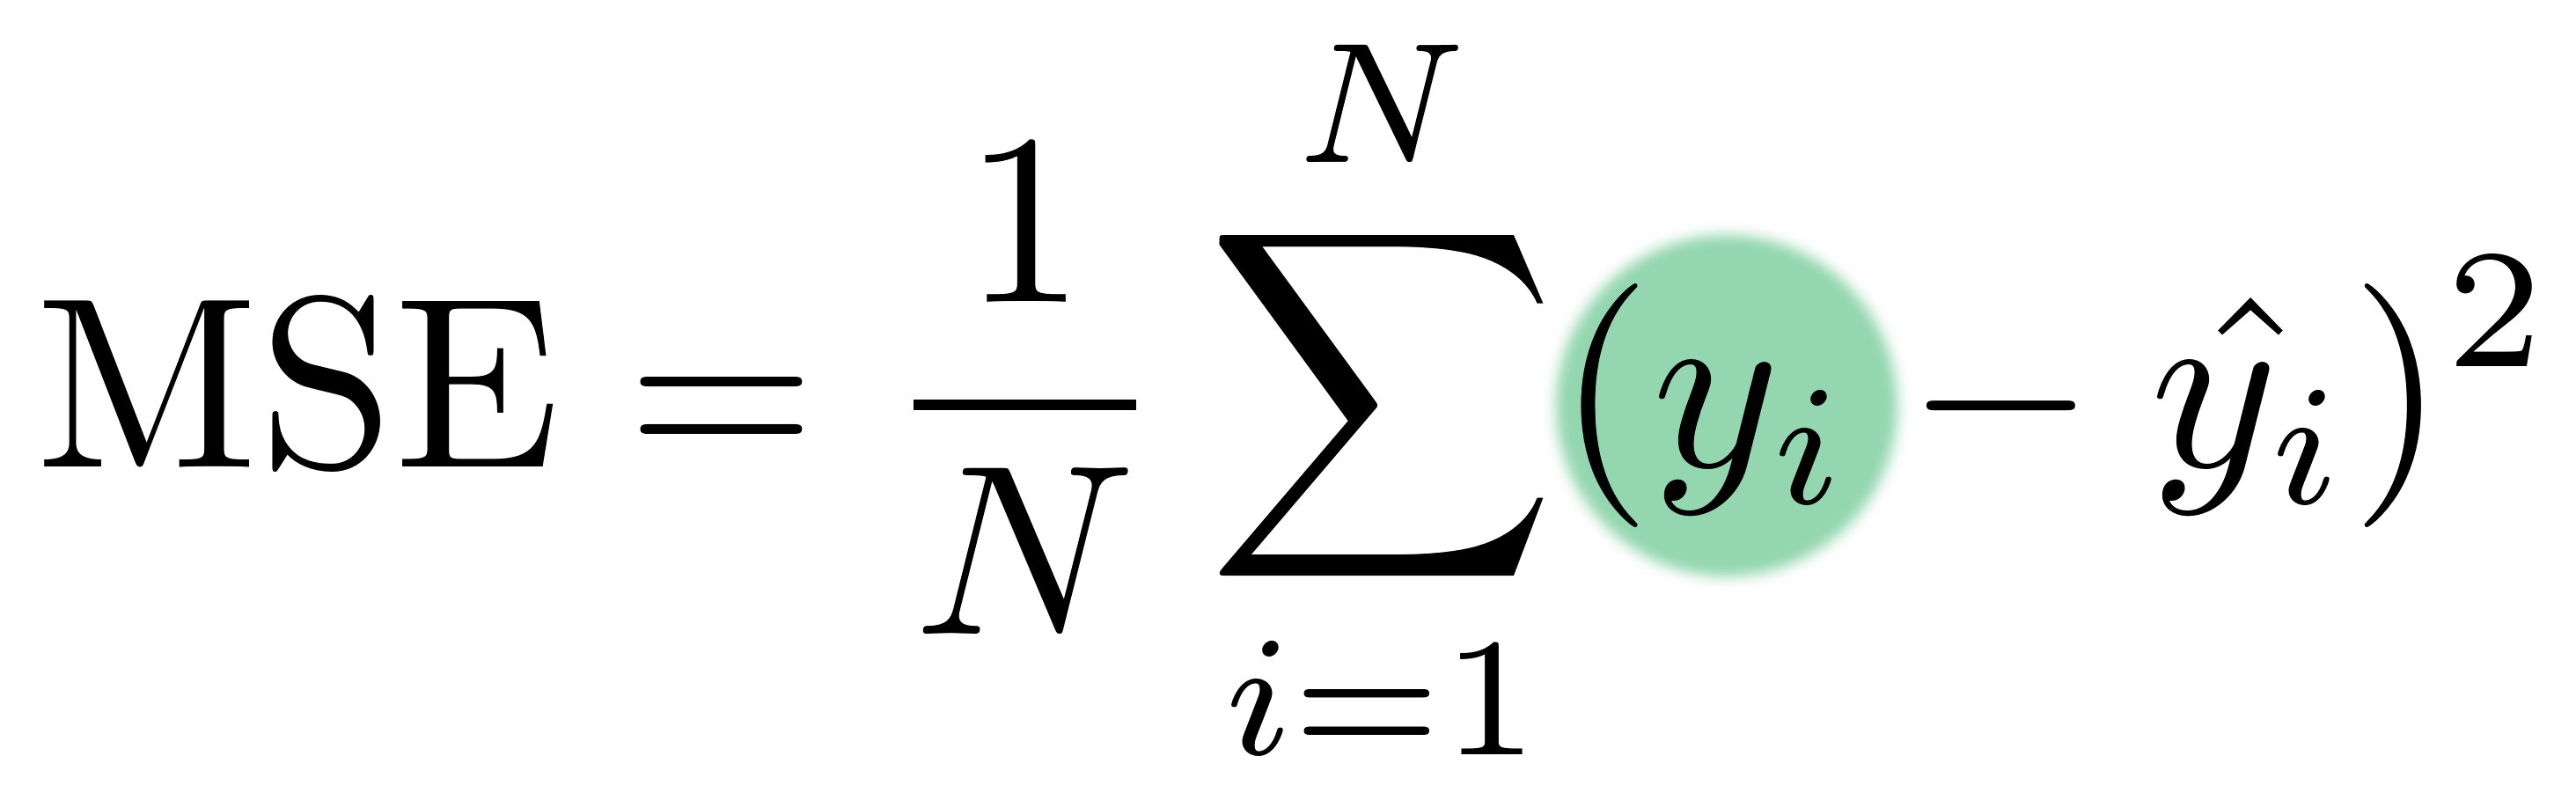
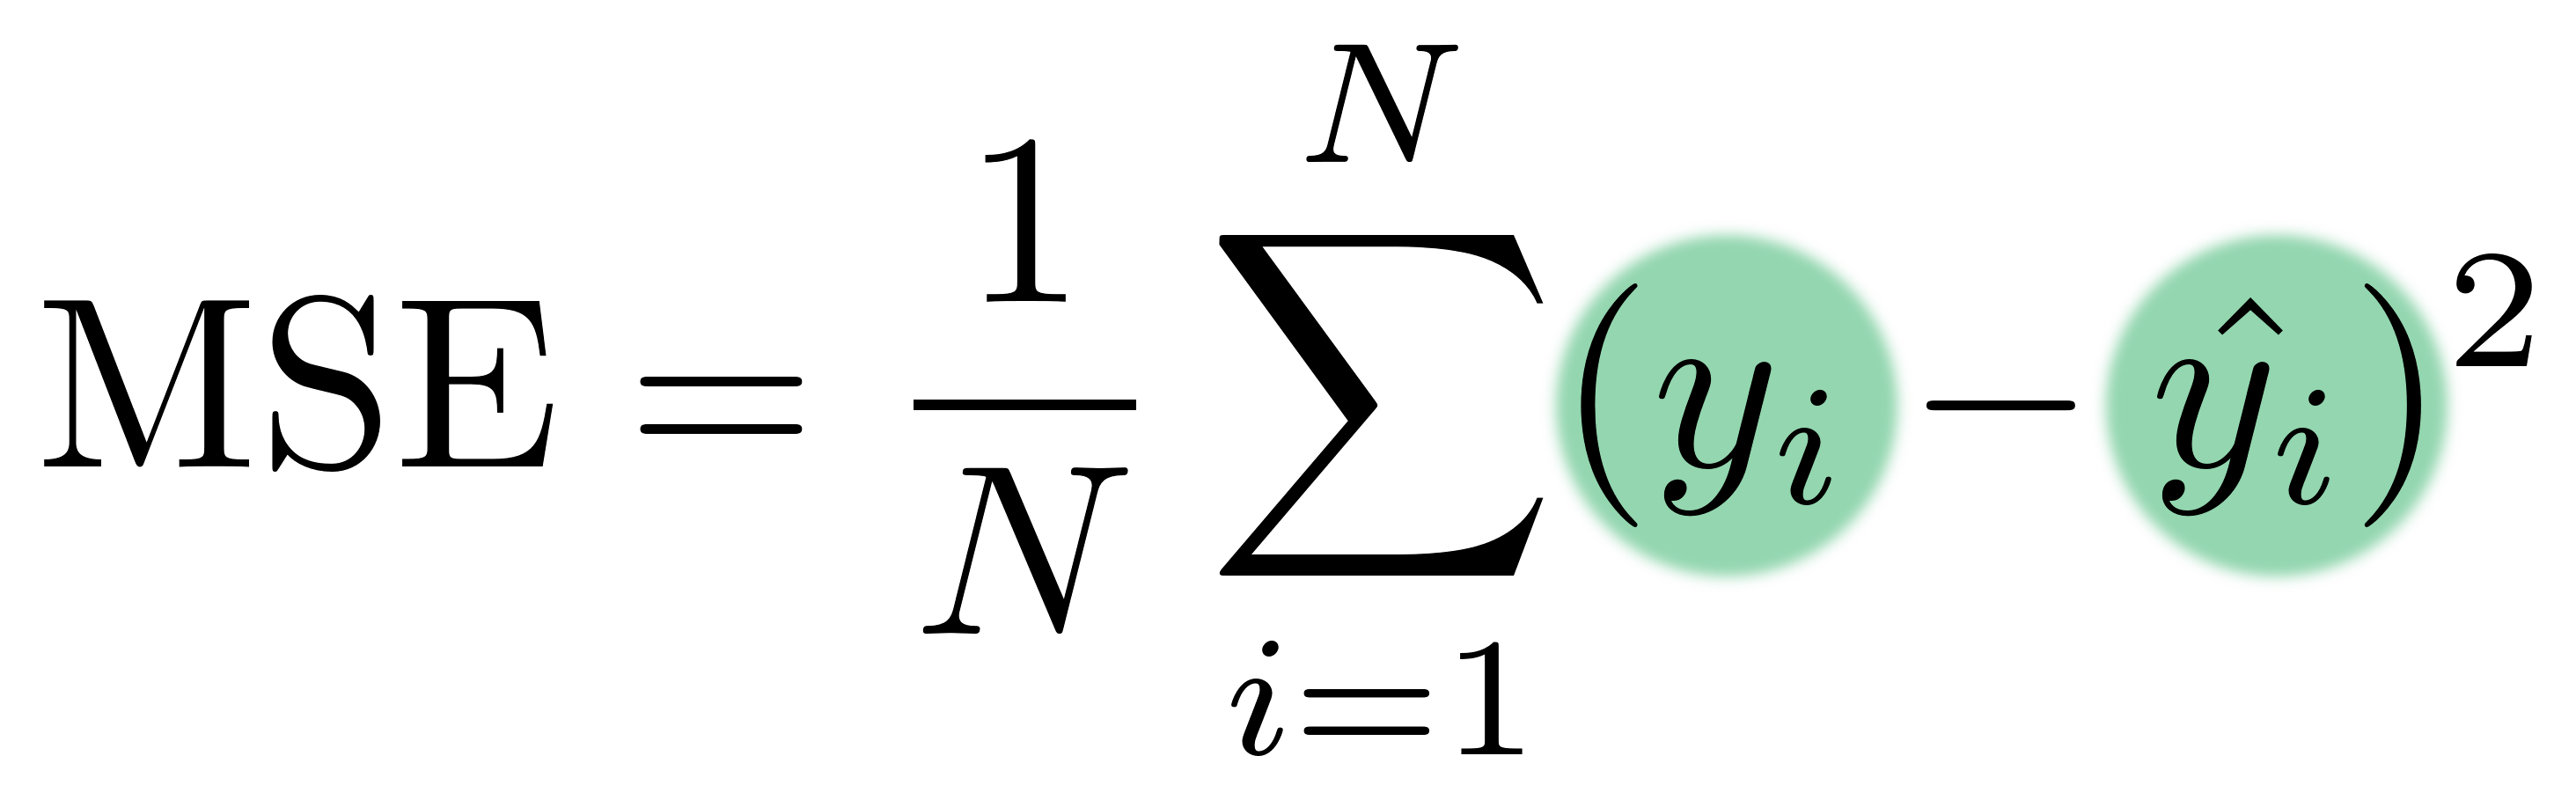
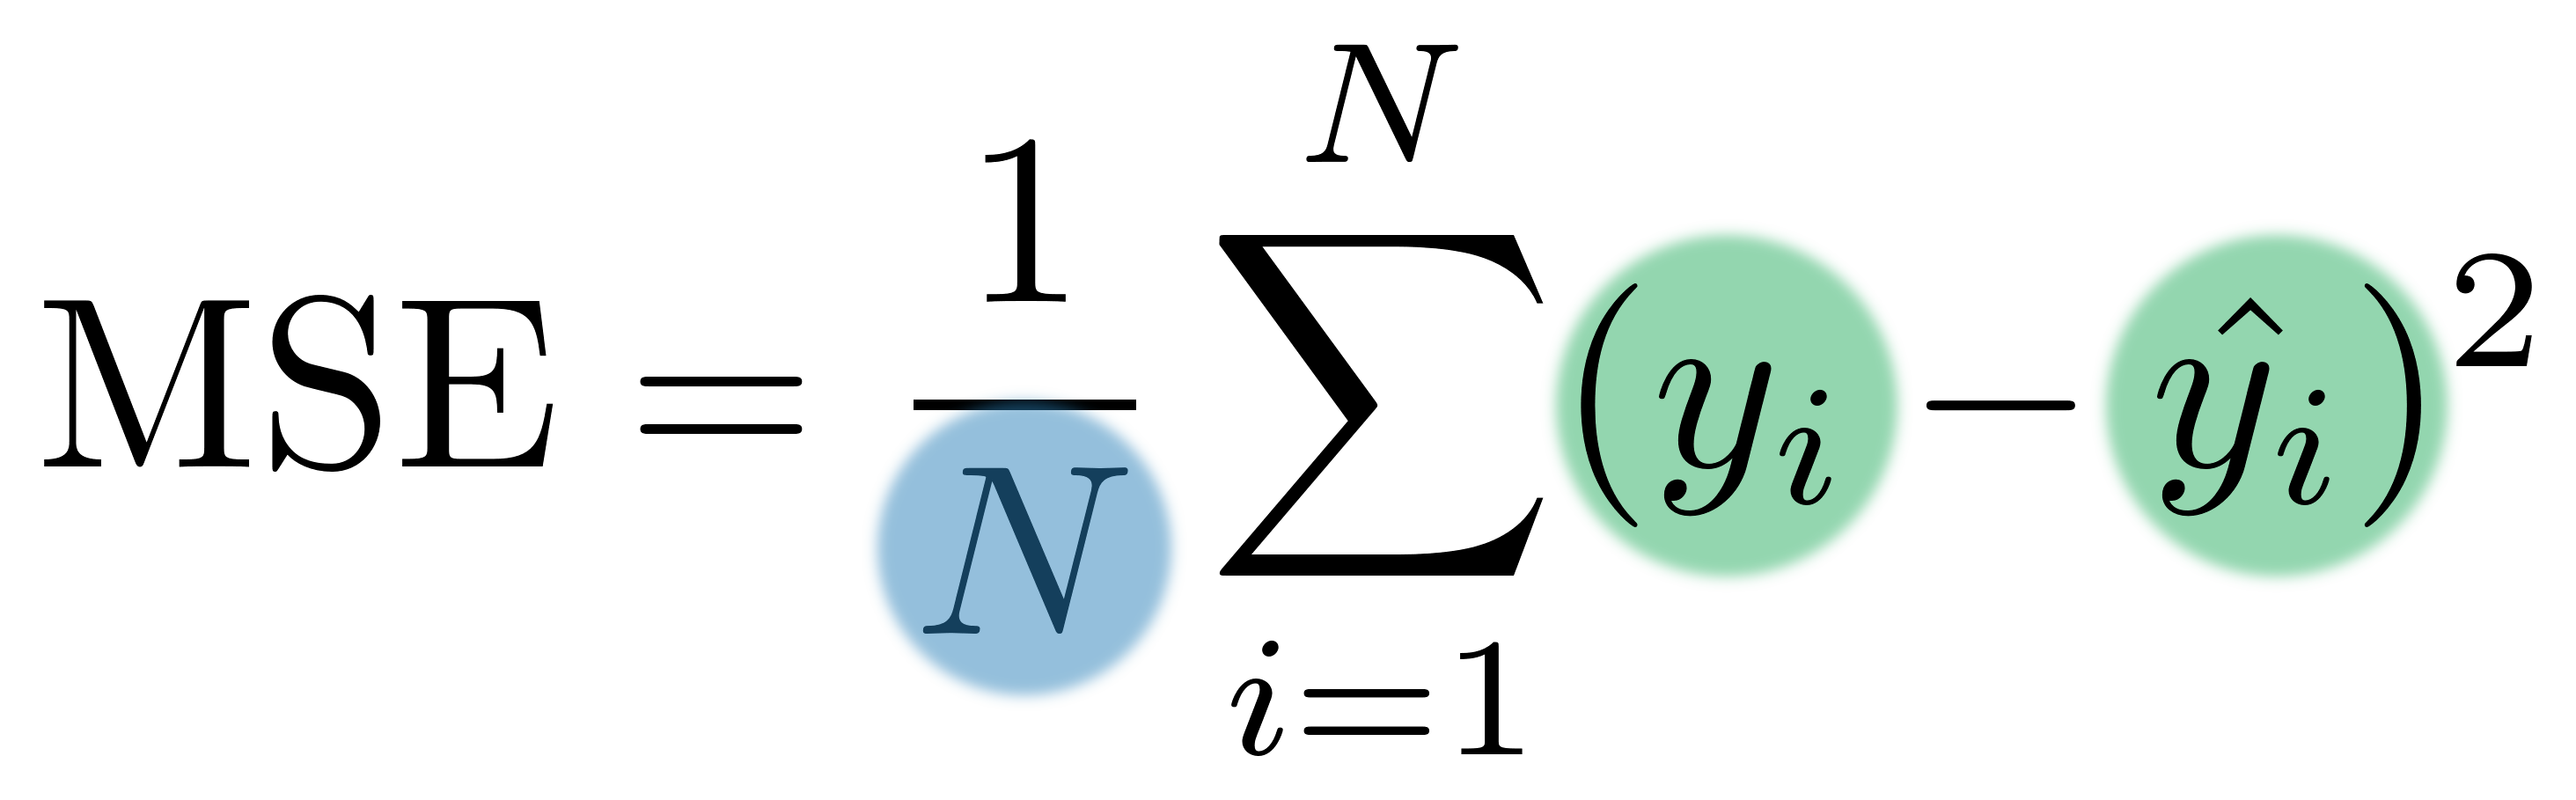
MSE = Mean Squared Error(平均二乗誤差)

$y_i$ — 観測値

$y_i$ — 観測値
$\hat{y_i}$ — 予測値(モデル)

$y_i$ — 観測値
$\hat{y_i}$ — 予測値(モデル)
mass、cyl、type_dummyでconsumptionを予測します。
予測子を1列に統合します。
+------+---+-------------+----------------------------+-----------+
|mass |cyl|type_dummy |features |consumption|
+------+---+-------------+----------------------------+-----------+
|1451.0|6 |(5,[0],[1.0])|(7,[0,1,2],[1451.0,6.0,1.0])|9.05 |
|1129.0|4 |(5,[2],[1.0])|(7,[0,1,4],[1129.0,4.0,1.0])|6.53 |
|1399.0|4 |(5,[2],[1.0])|(7,[0,1,4],[1399.0,4.0,1.0])|7.84 |
|1147.0|4 |(5,[1],[1.0])|(7,[0,1,3],[1147.0,4.0,1.0])|7.84 |
|1111.0|4 |(5,[3],[1.0])|(7,[0,1,5],[1111.0,4.0,1.0])|9.05 |
+------+---+-------------+----------------------------+-----------+
from pyspark.ml.regression import LinearRegression
regression = LinearRegression(labelCol='consumption')
cars_train(学習データ)で学習します。
regression = regression.fit(cars_train)
cars_test(テストデータ)で予測します。
predictions = regression.transform(cars_test)
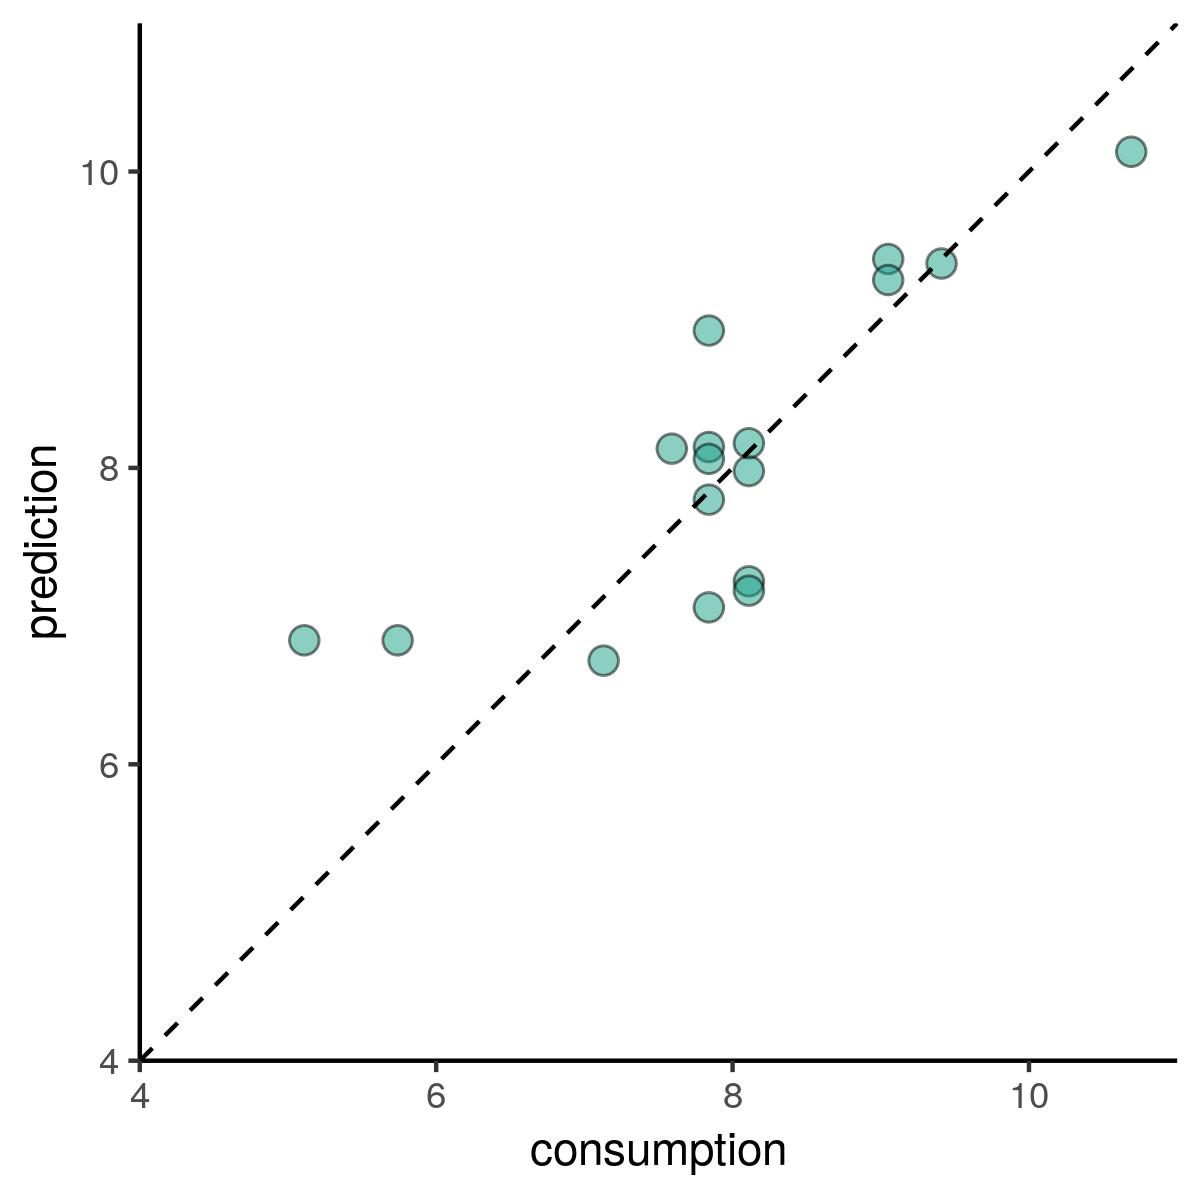
+-----------+------------------+
|consumption|prediction |
+-----------+------------------+
|7.84 |8.92699470743403 |
|9.41 |9.379295891451353 |
|8.11 |7.23487264538364 |
|9.05 |9.409860194333735 |
|7.84 |7.059190923328711 |
|7.84 |7.785909738591766 |
|7.59 |8.129959405168547 |
|5.11 |6.836843743852942 |
|8.11 |7.17173702652015 |
+-----------+------------------+

from pyspark.ml.evaluation import RegressionEvaluator
# Find RMSE (Root Mean Squared Error)
RegressionEvaluator(labelCol='consumption').evaluate(predictions)
0.708699086182001
RegressionEvaluatorは次の指標も算出可能です:
mae(平均絶対誤差)r2($R^2$)mse(平均二乗誤差)
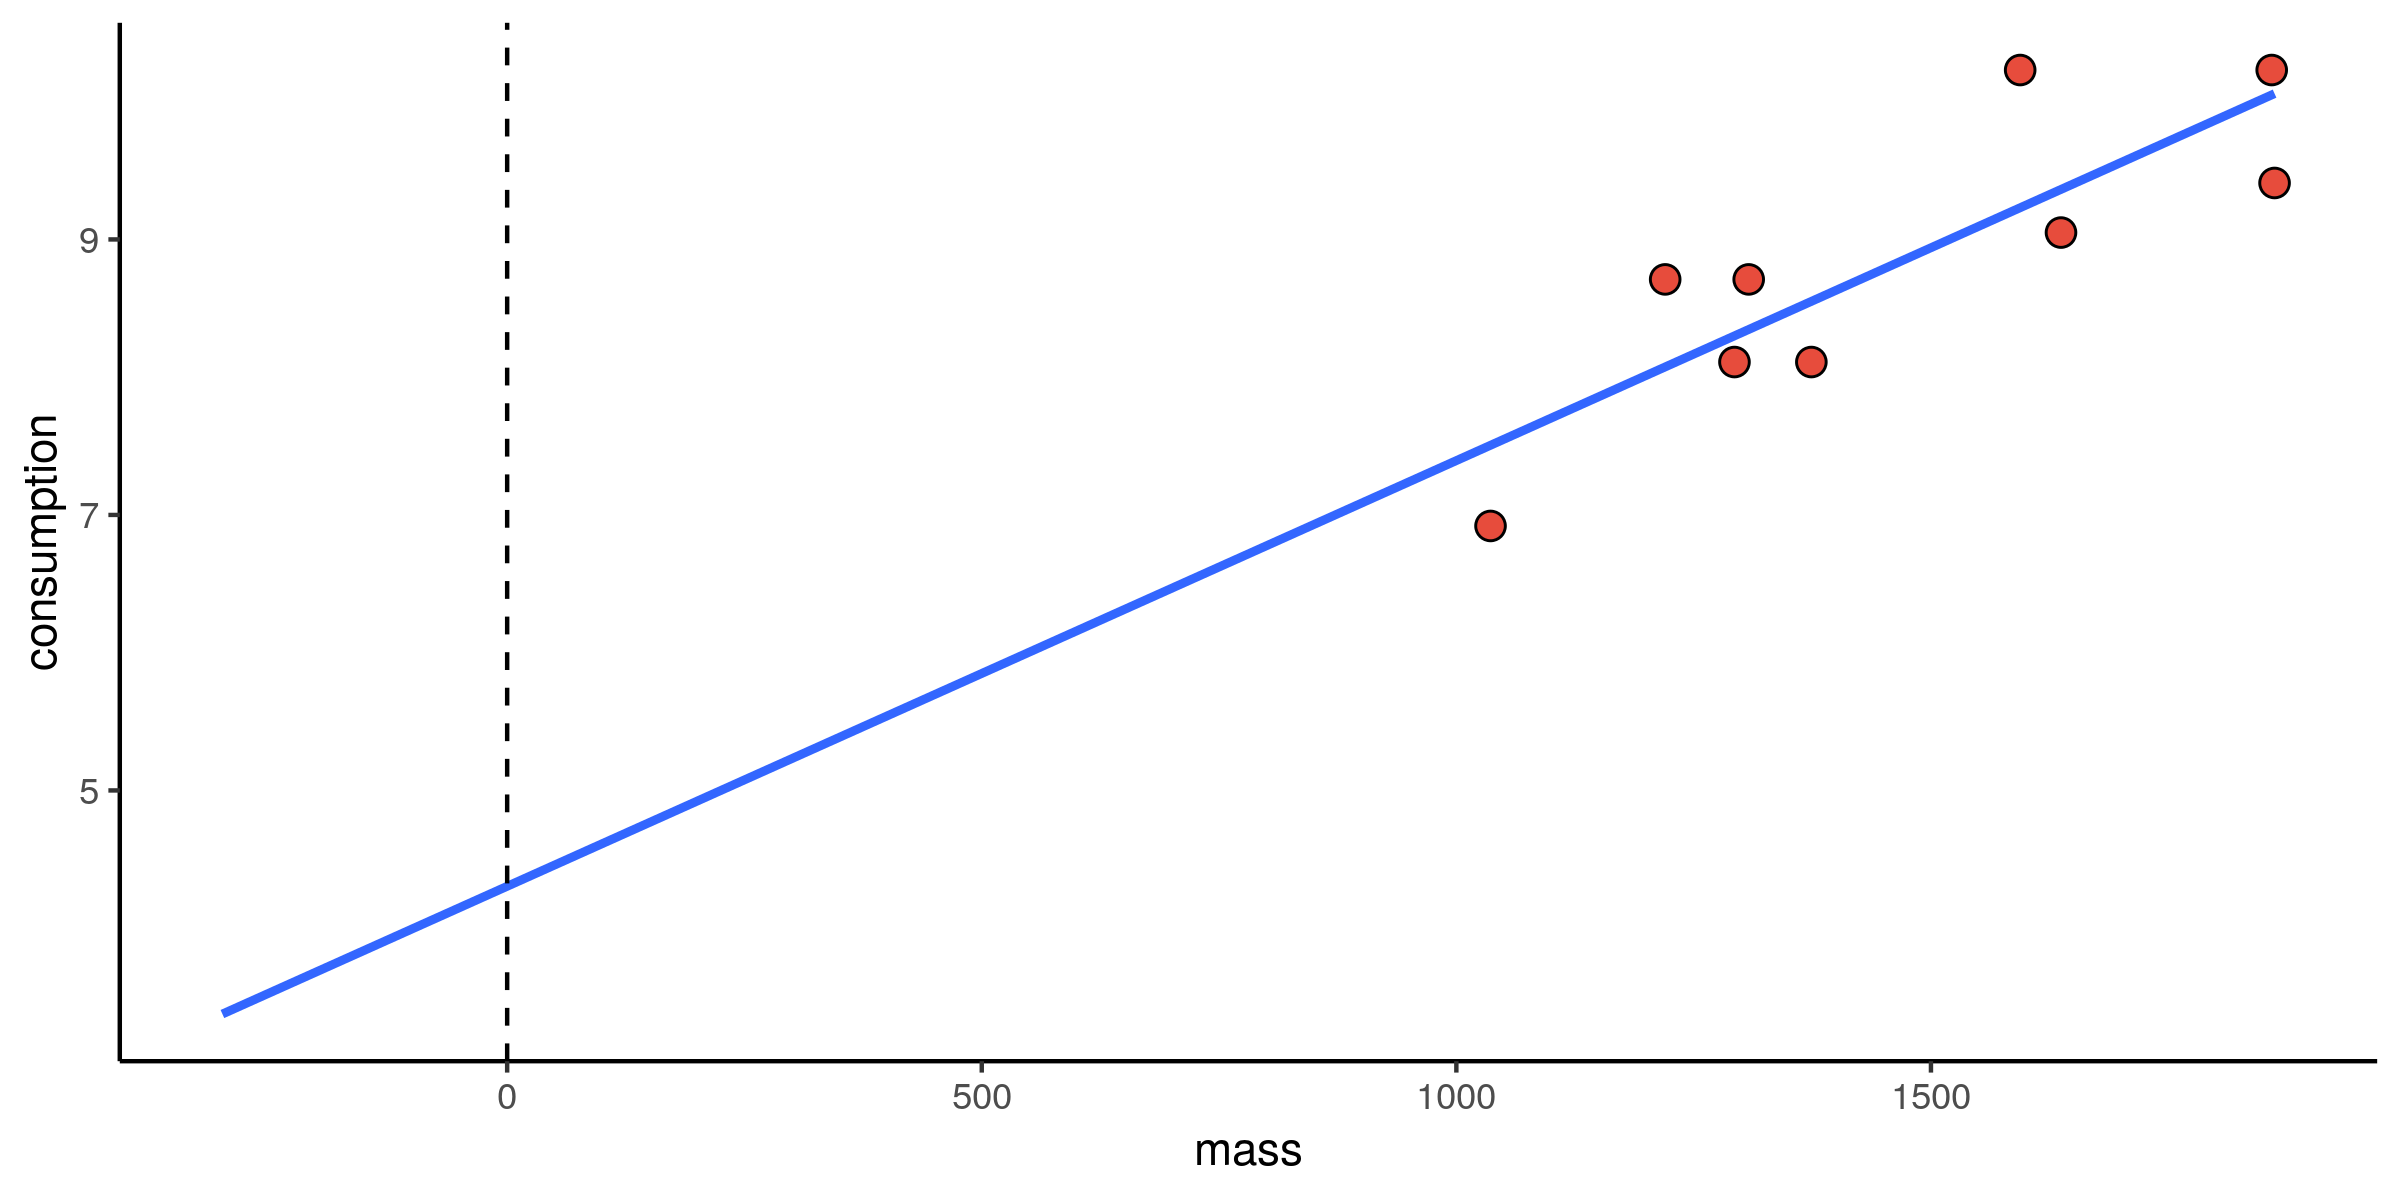
regression.intercept
4.9450616833727095
これは(仮想的に)次の場合の燃料消費量です:
mass = 0cyl = 0
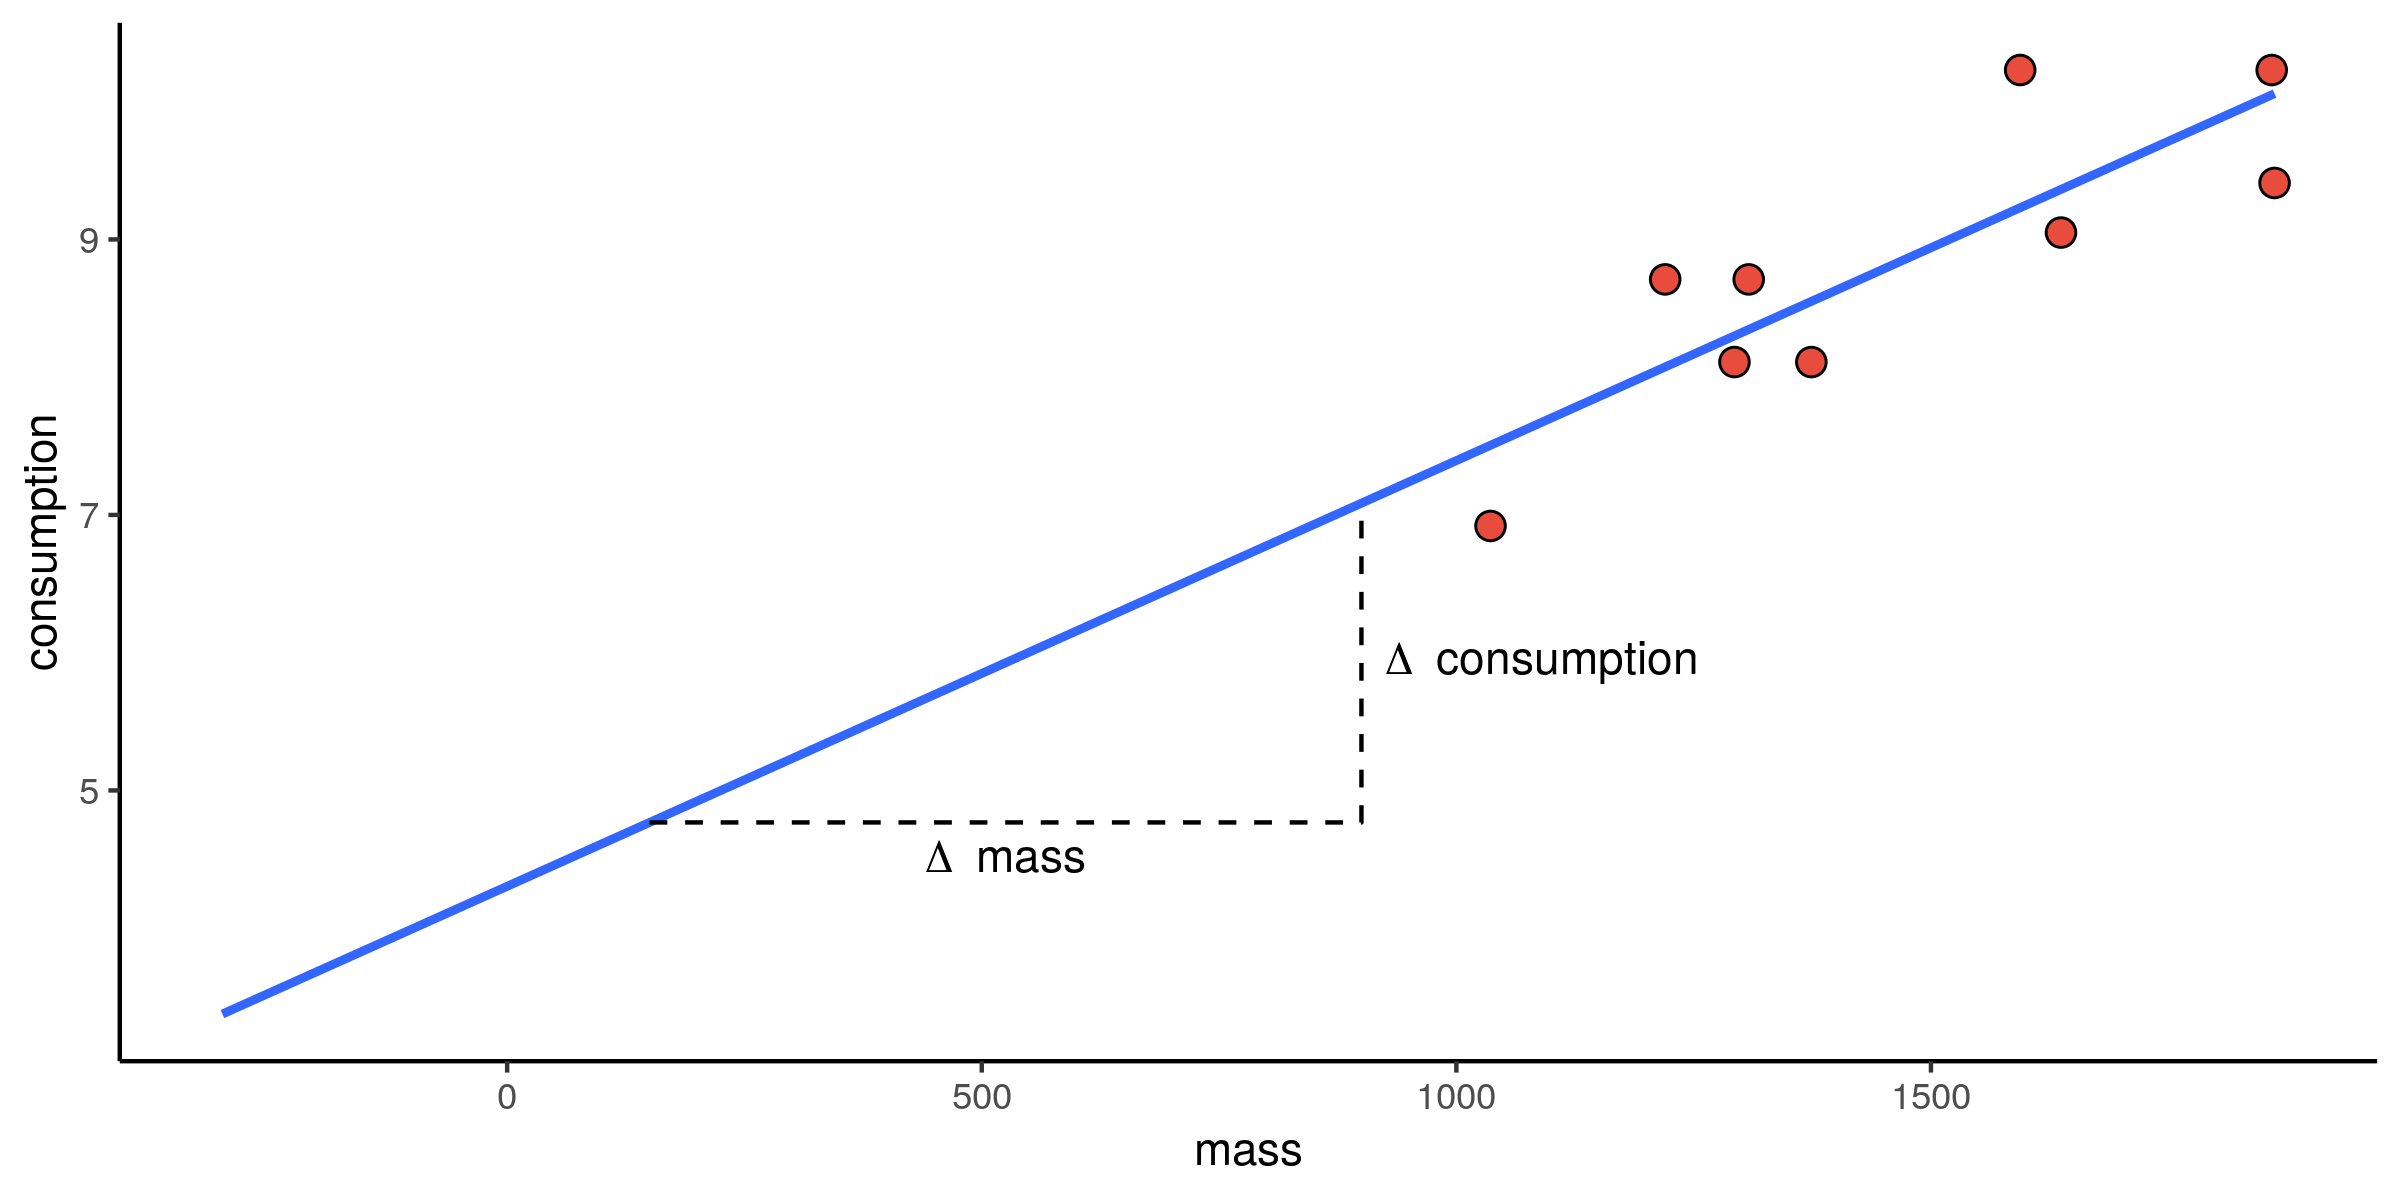
regression.coefficients
DenseVector([0.0027, 0.1897, -1.309, -1.7933, -1.3594, -1.2917, -1.9693])
mass 0.0027
cyl 0.1897
Midsize -1.3090
Small -1.7933
Compact -1.3594
Sporty -1.2917
Large -1.9693
Machine Learning with PySpark