ロジスティック回帰

Machine Learning with PySpark

Andrew Collier

Data Scientist, Fathom Data

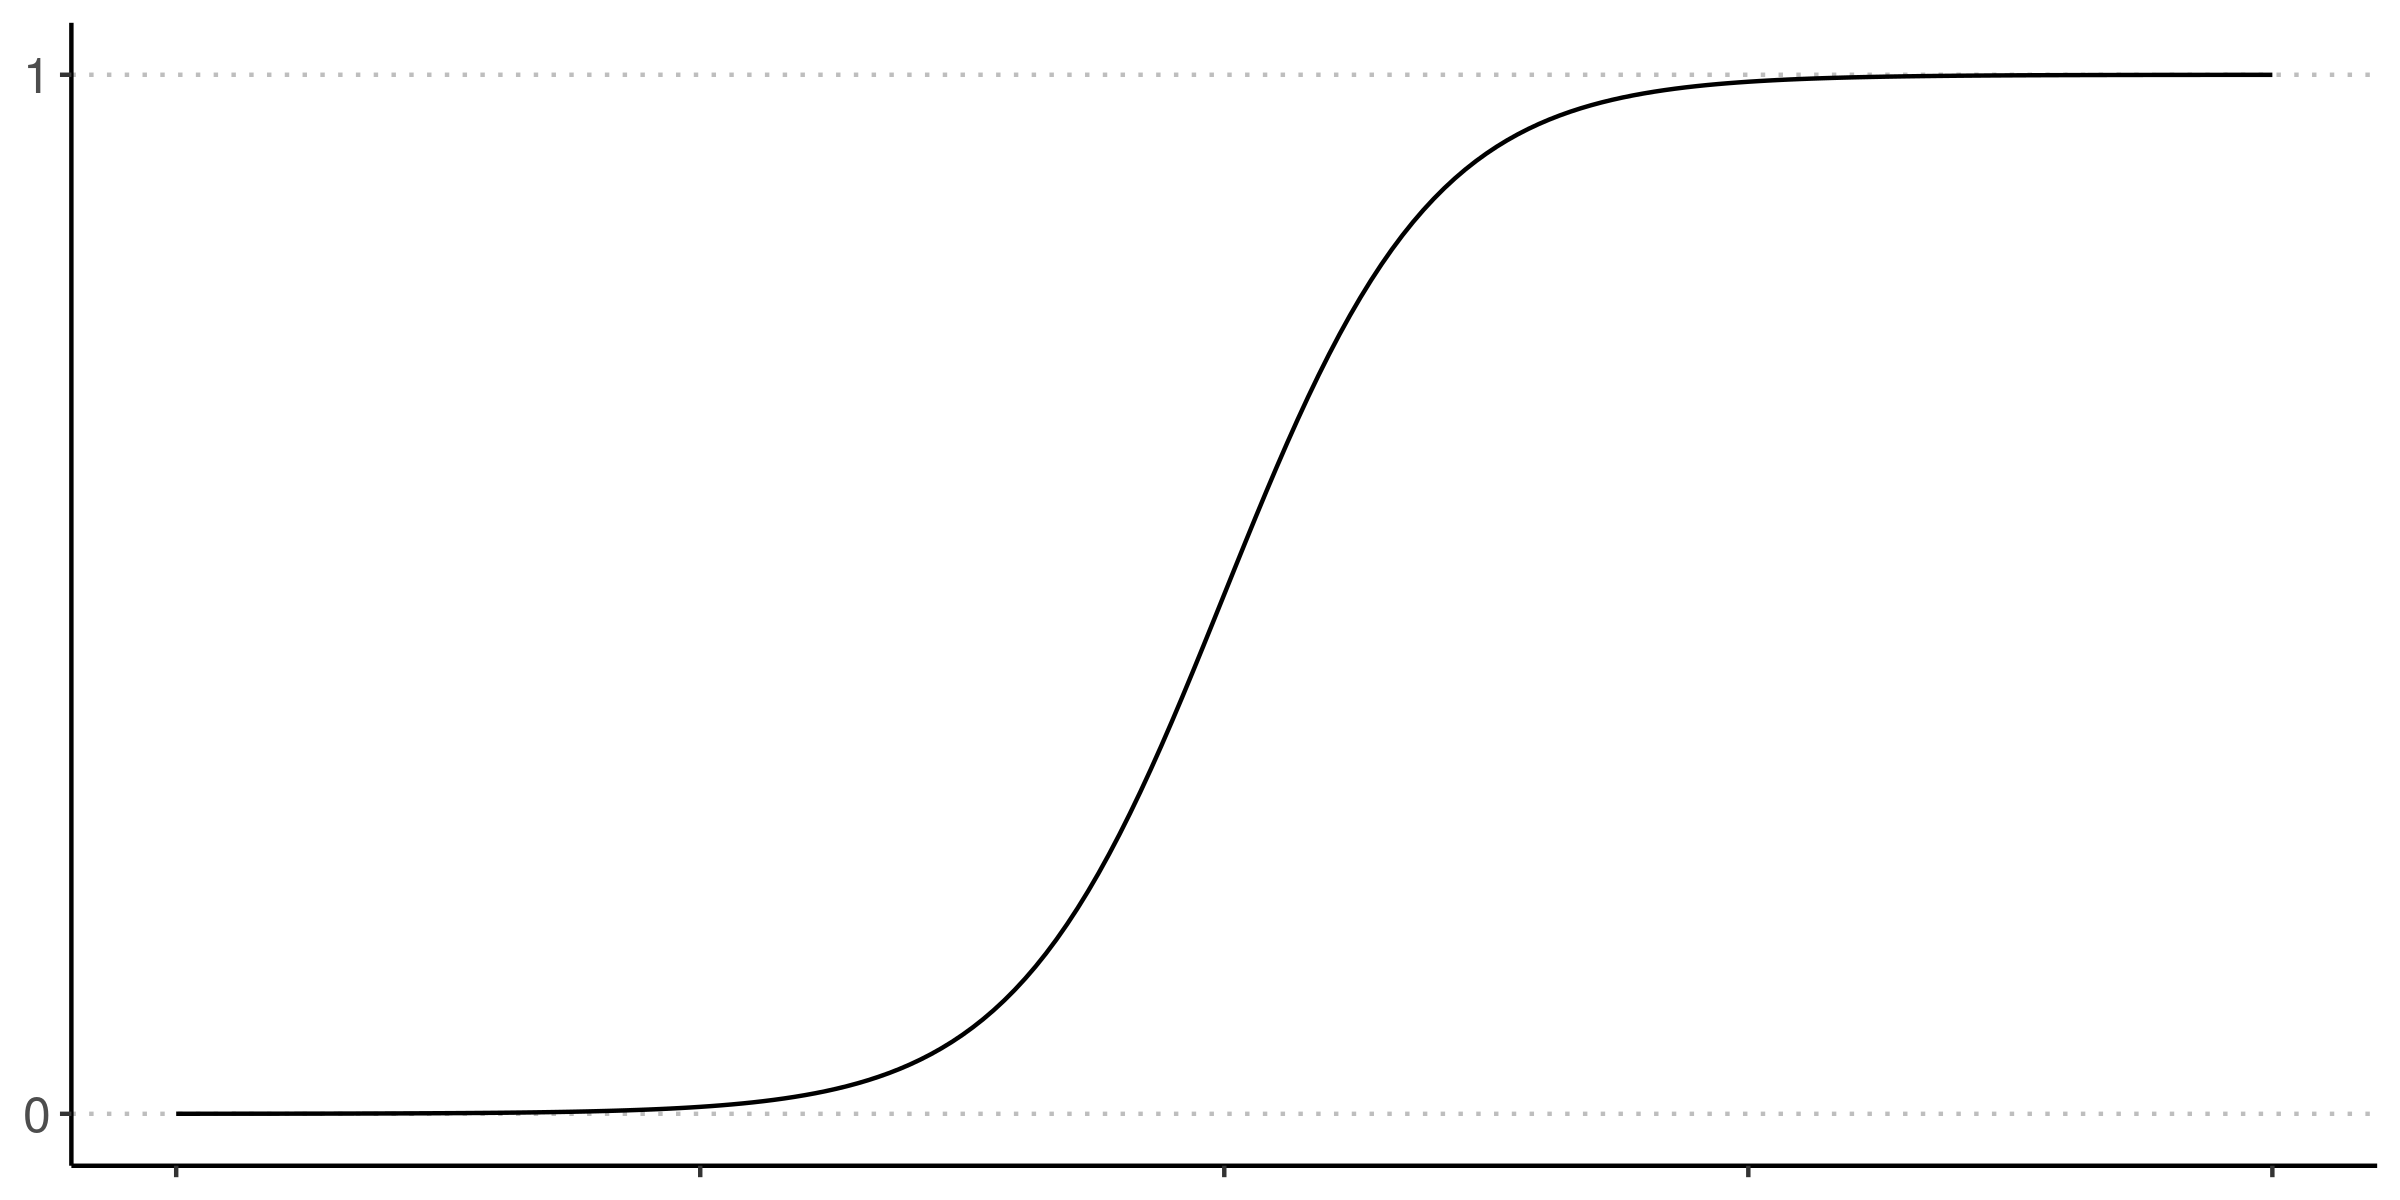
ロジスティック曲線

ロジスティック曲線

Machine Learning with PySpark

ロジスティック曲線

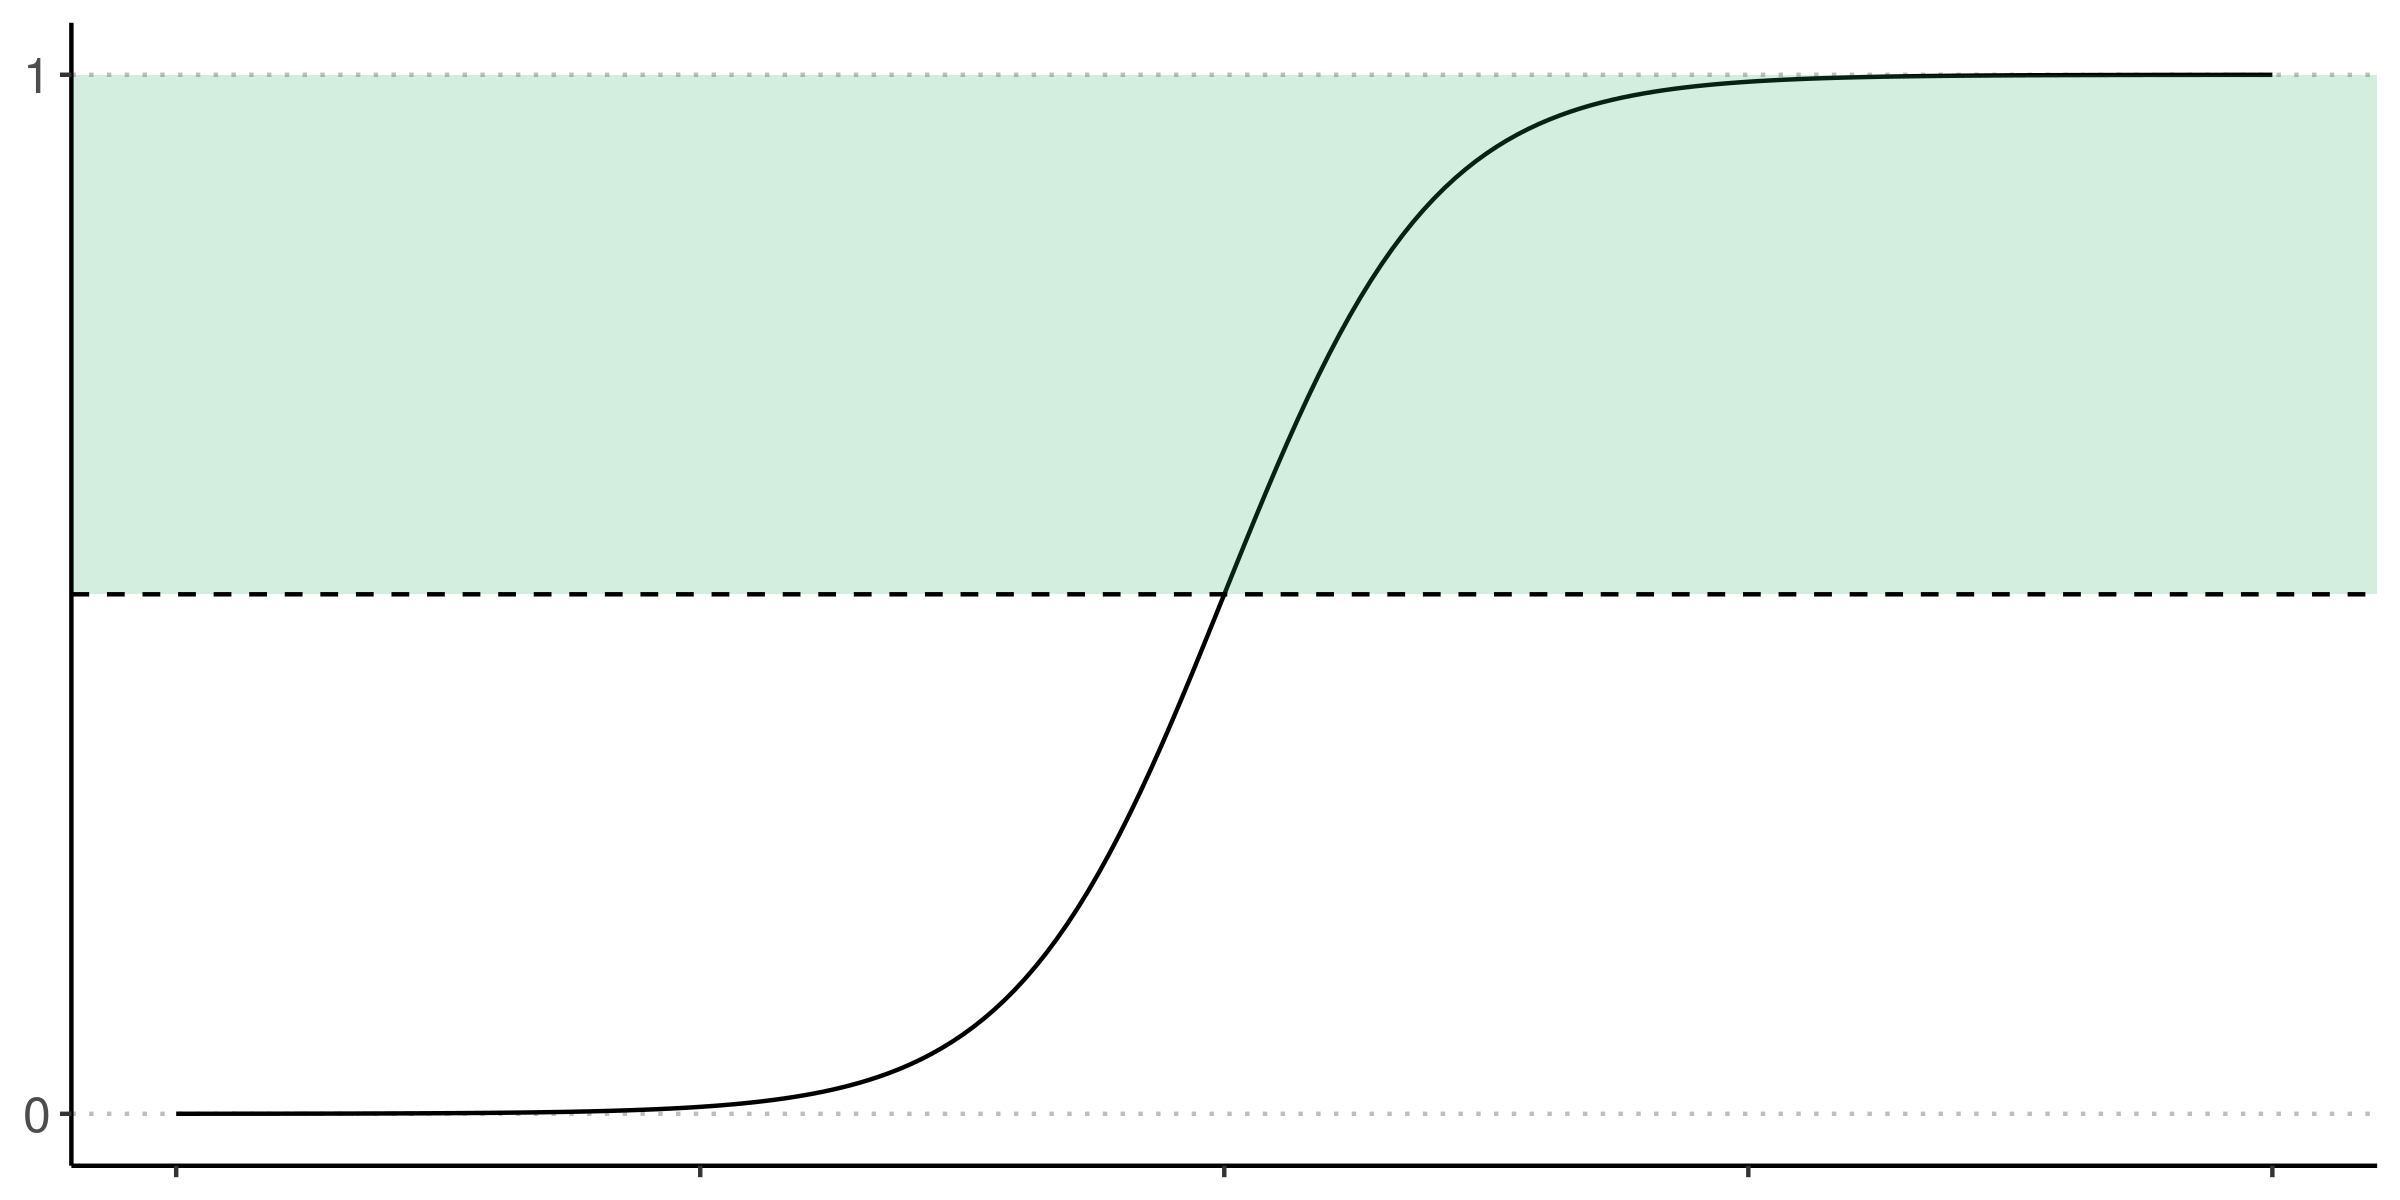
しきい値より上を塗ったロジスティック曲線

Machine Learning with PySpark

ロジスティック曲線

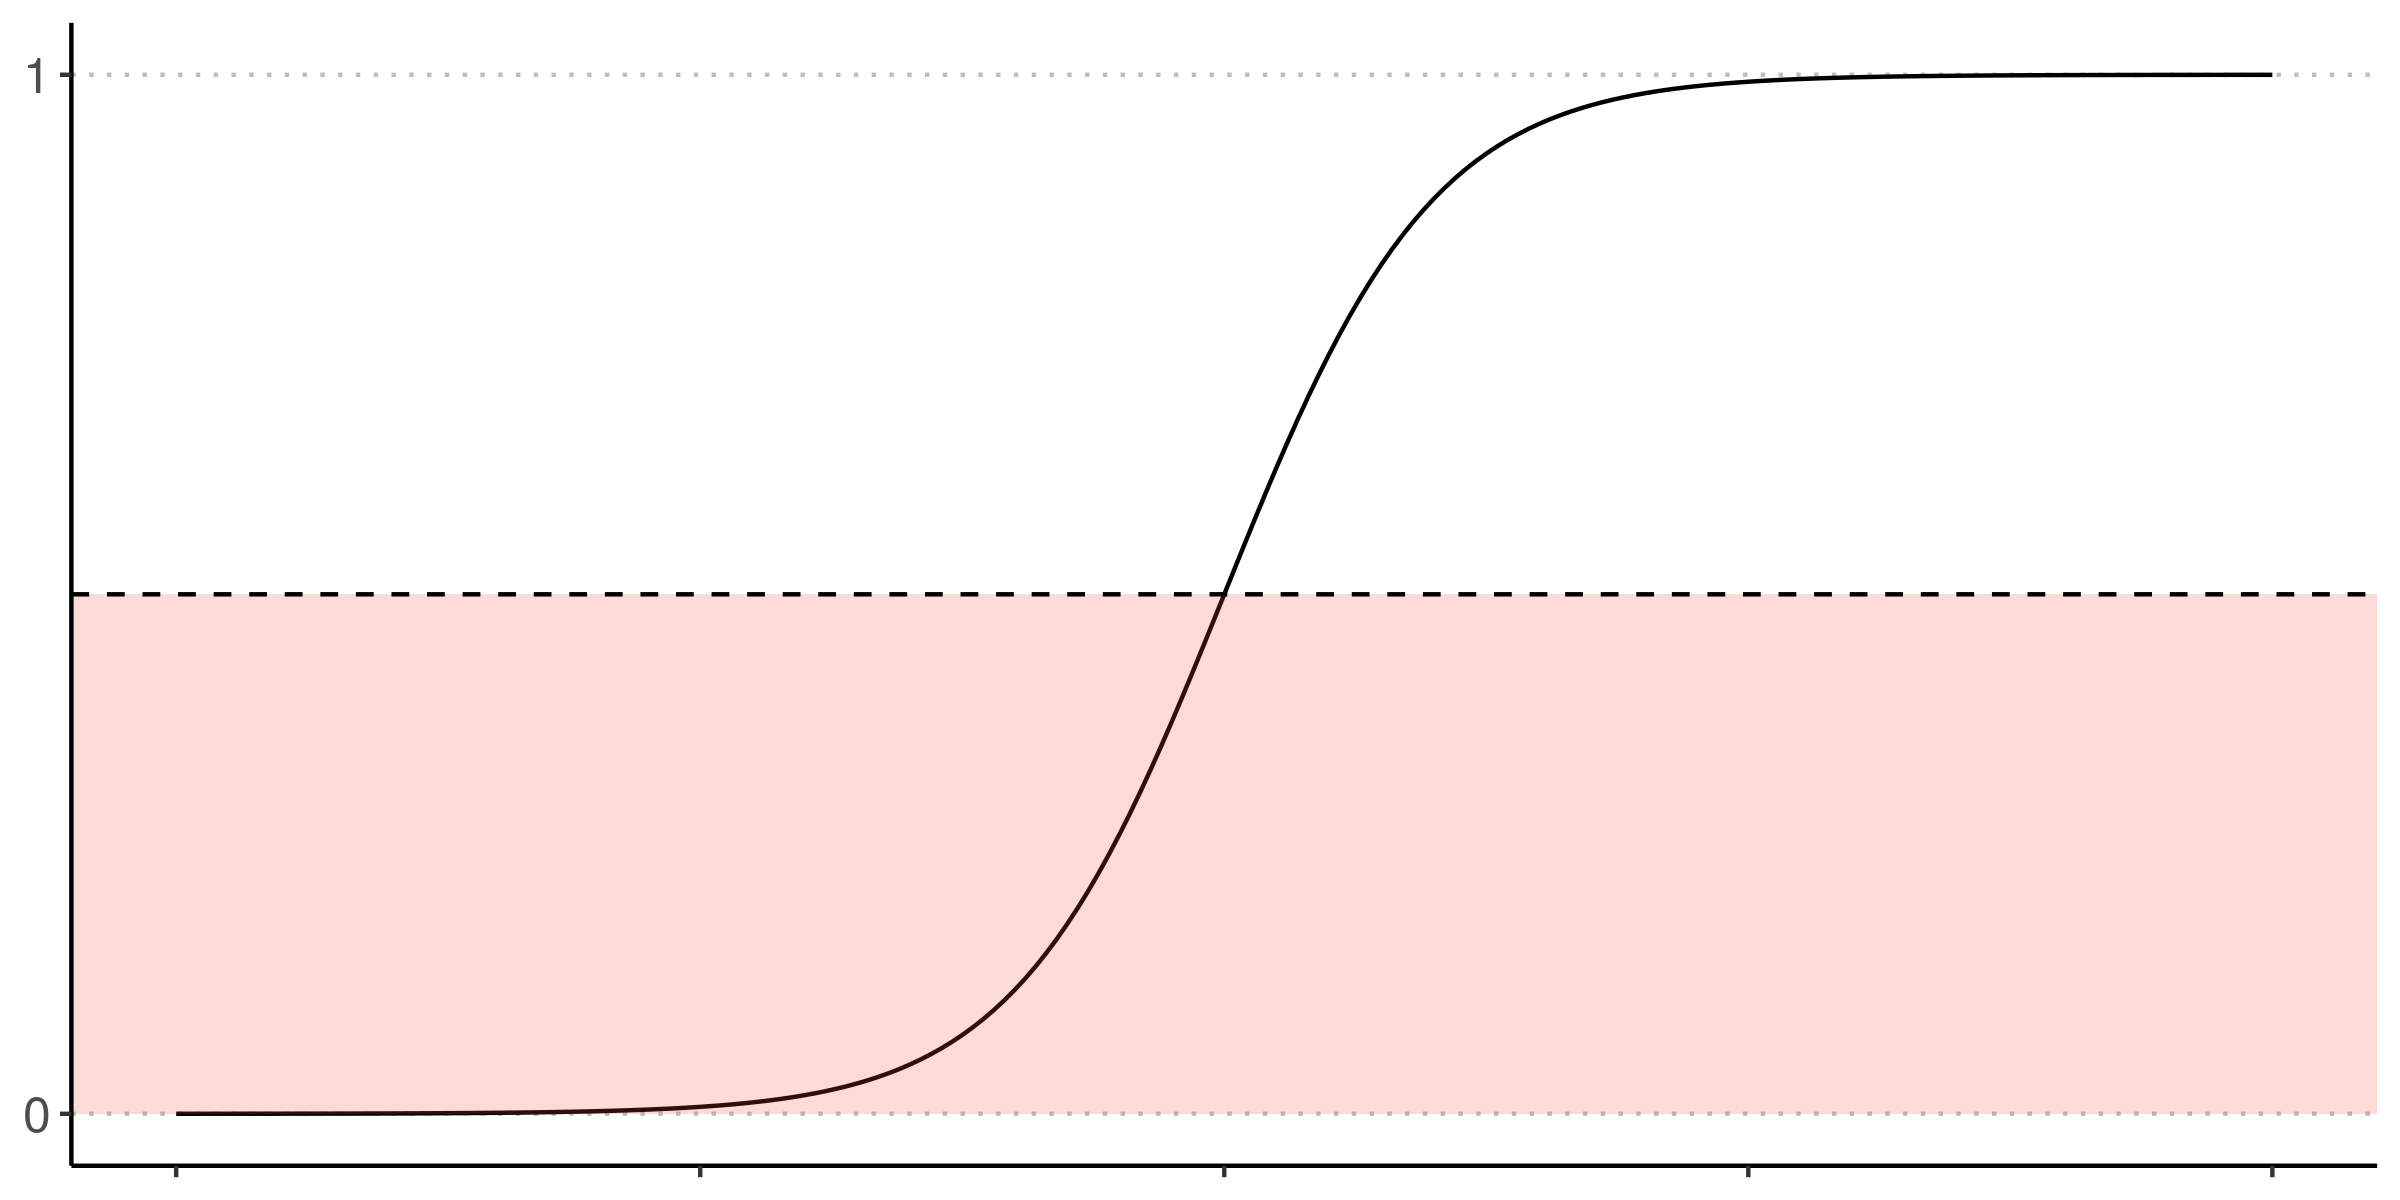
しきい値より下を塗ったロジスティック曲線

Machine Learning with PySpark

ロジスティック曲線

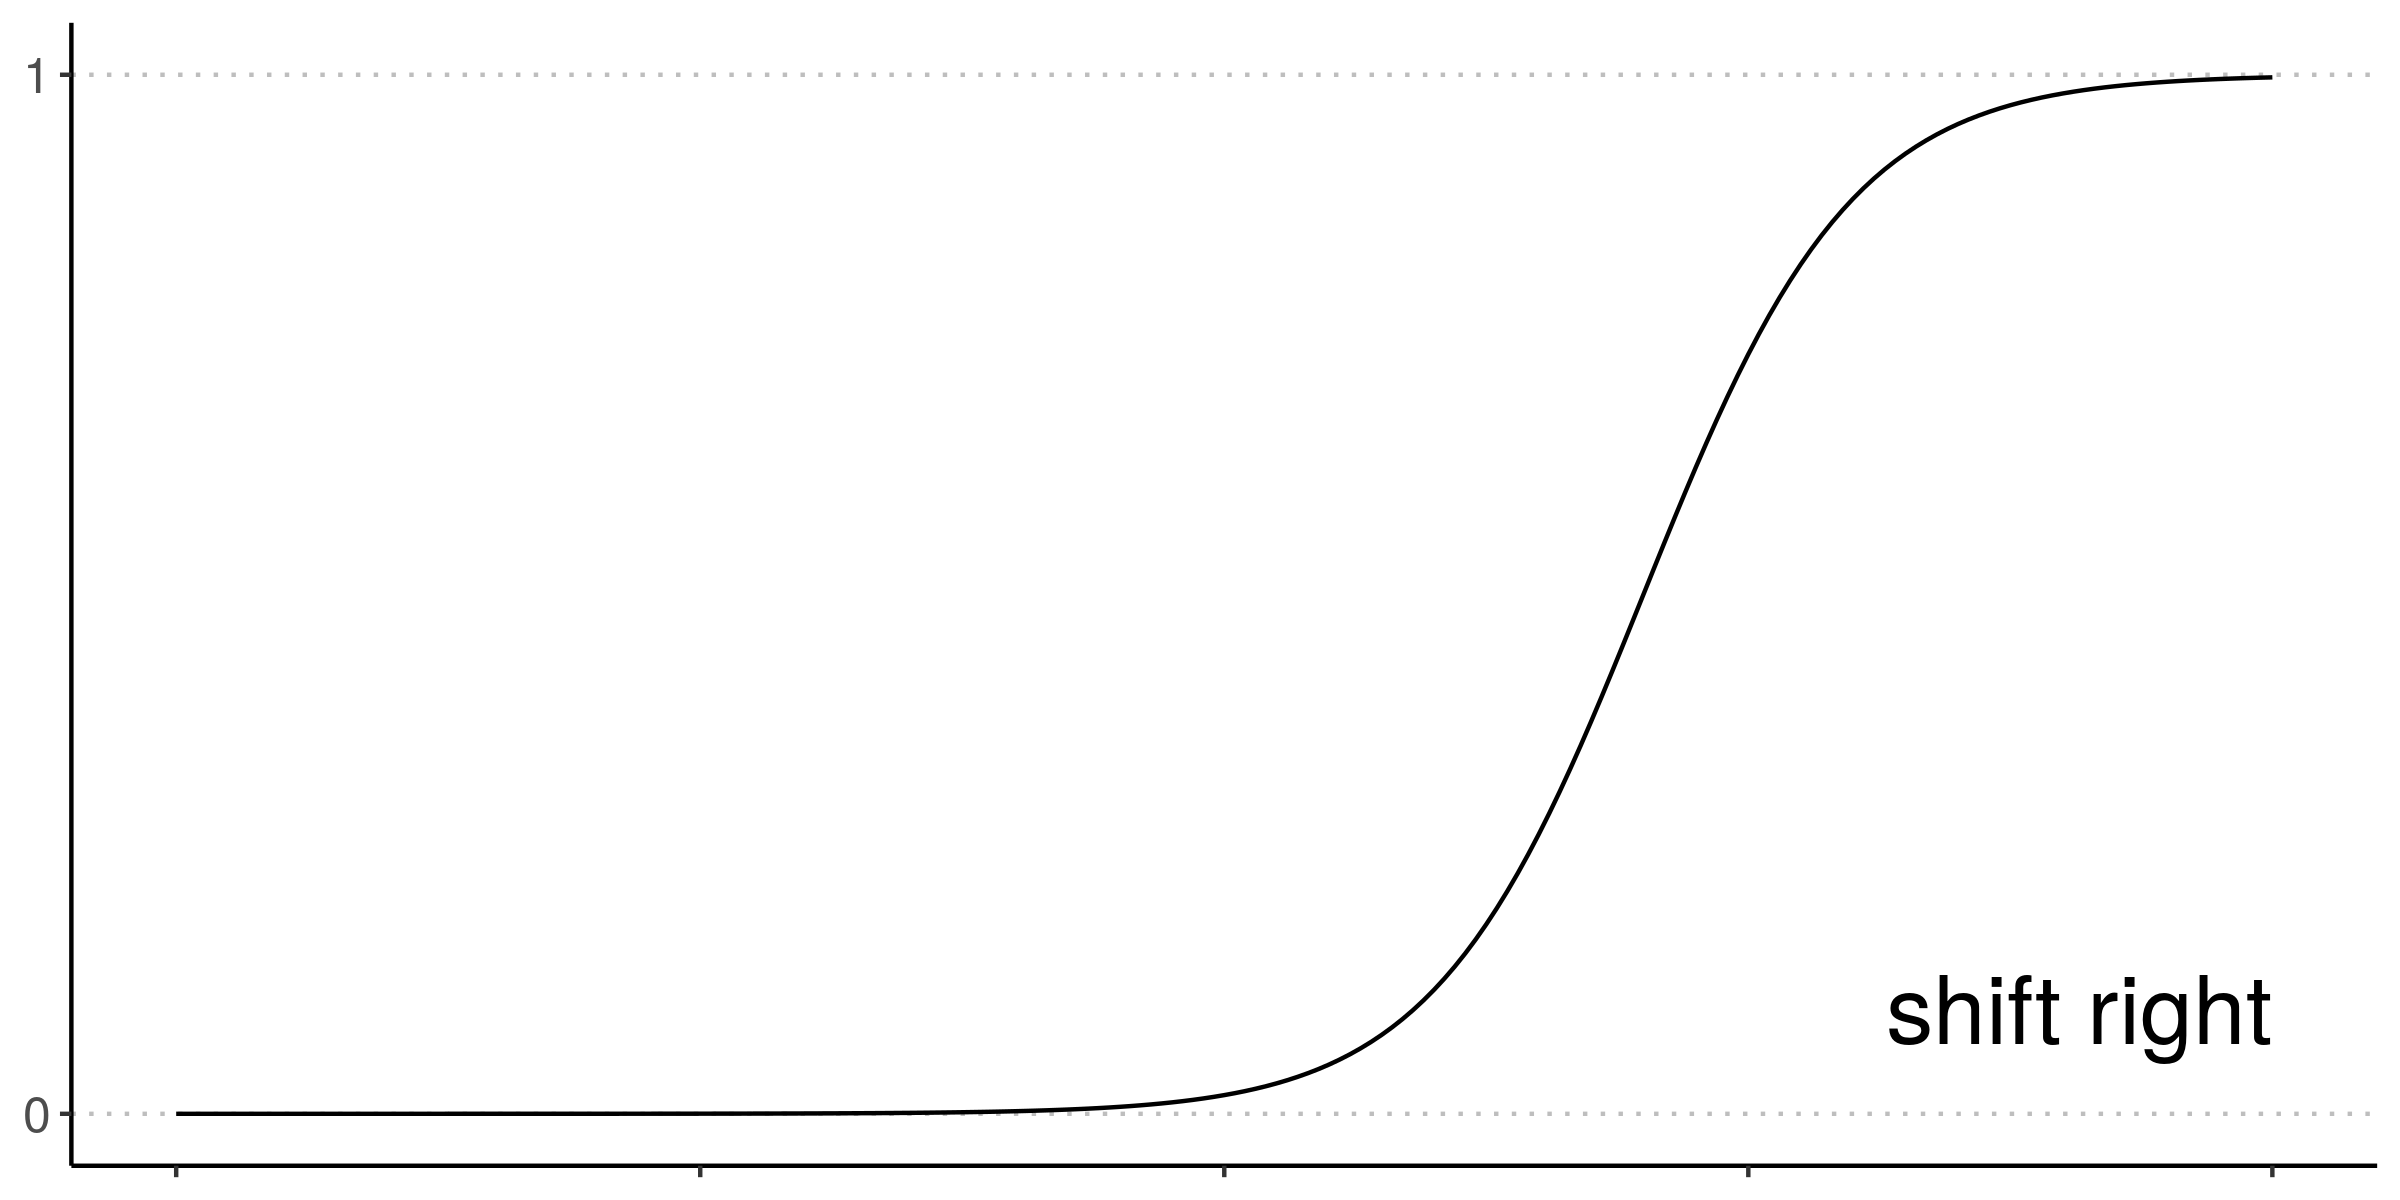
右にシフトしたロジスティック曲線

Machine Learning with PySpark

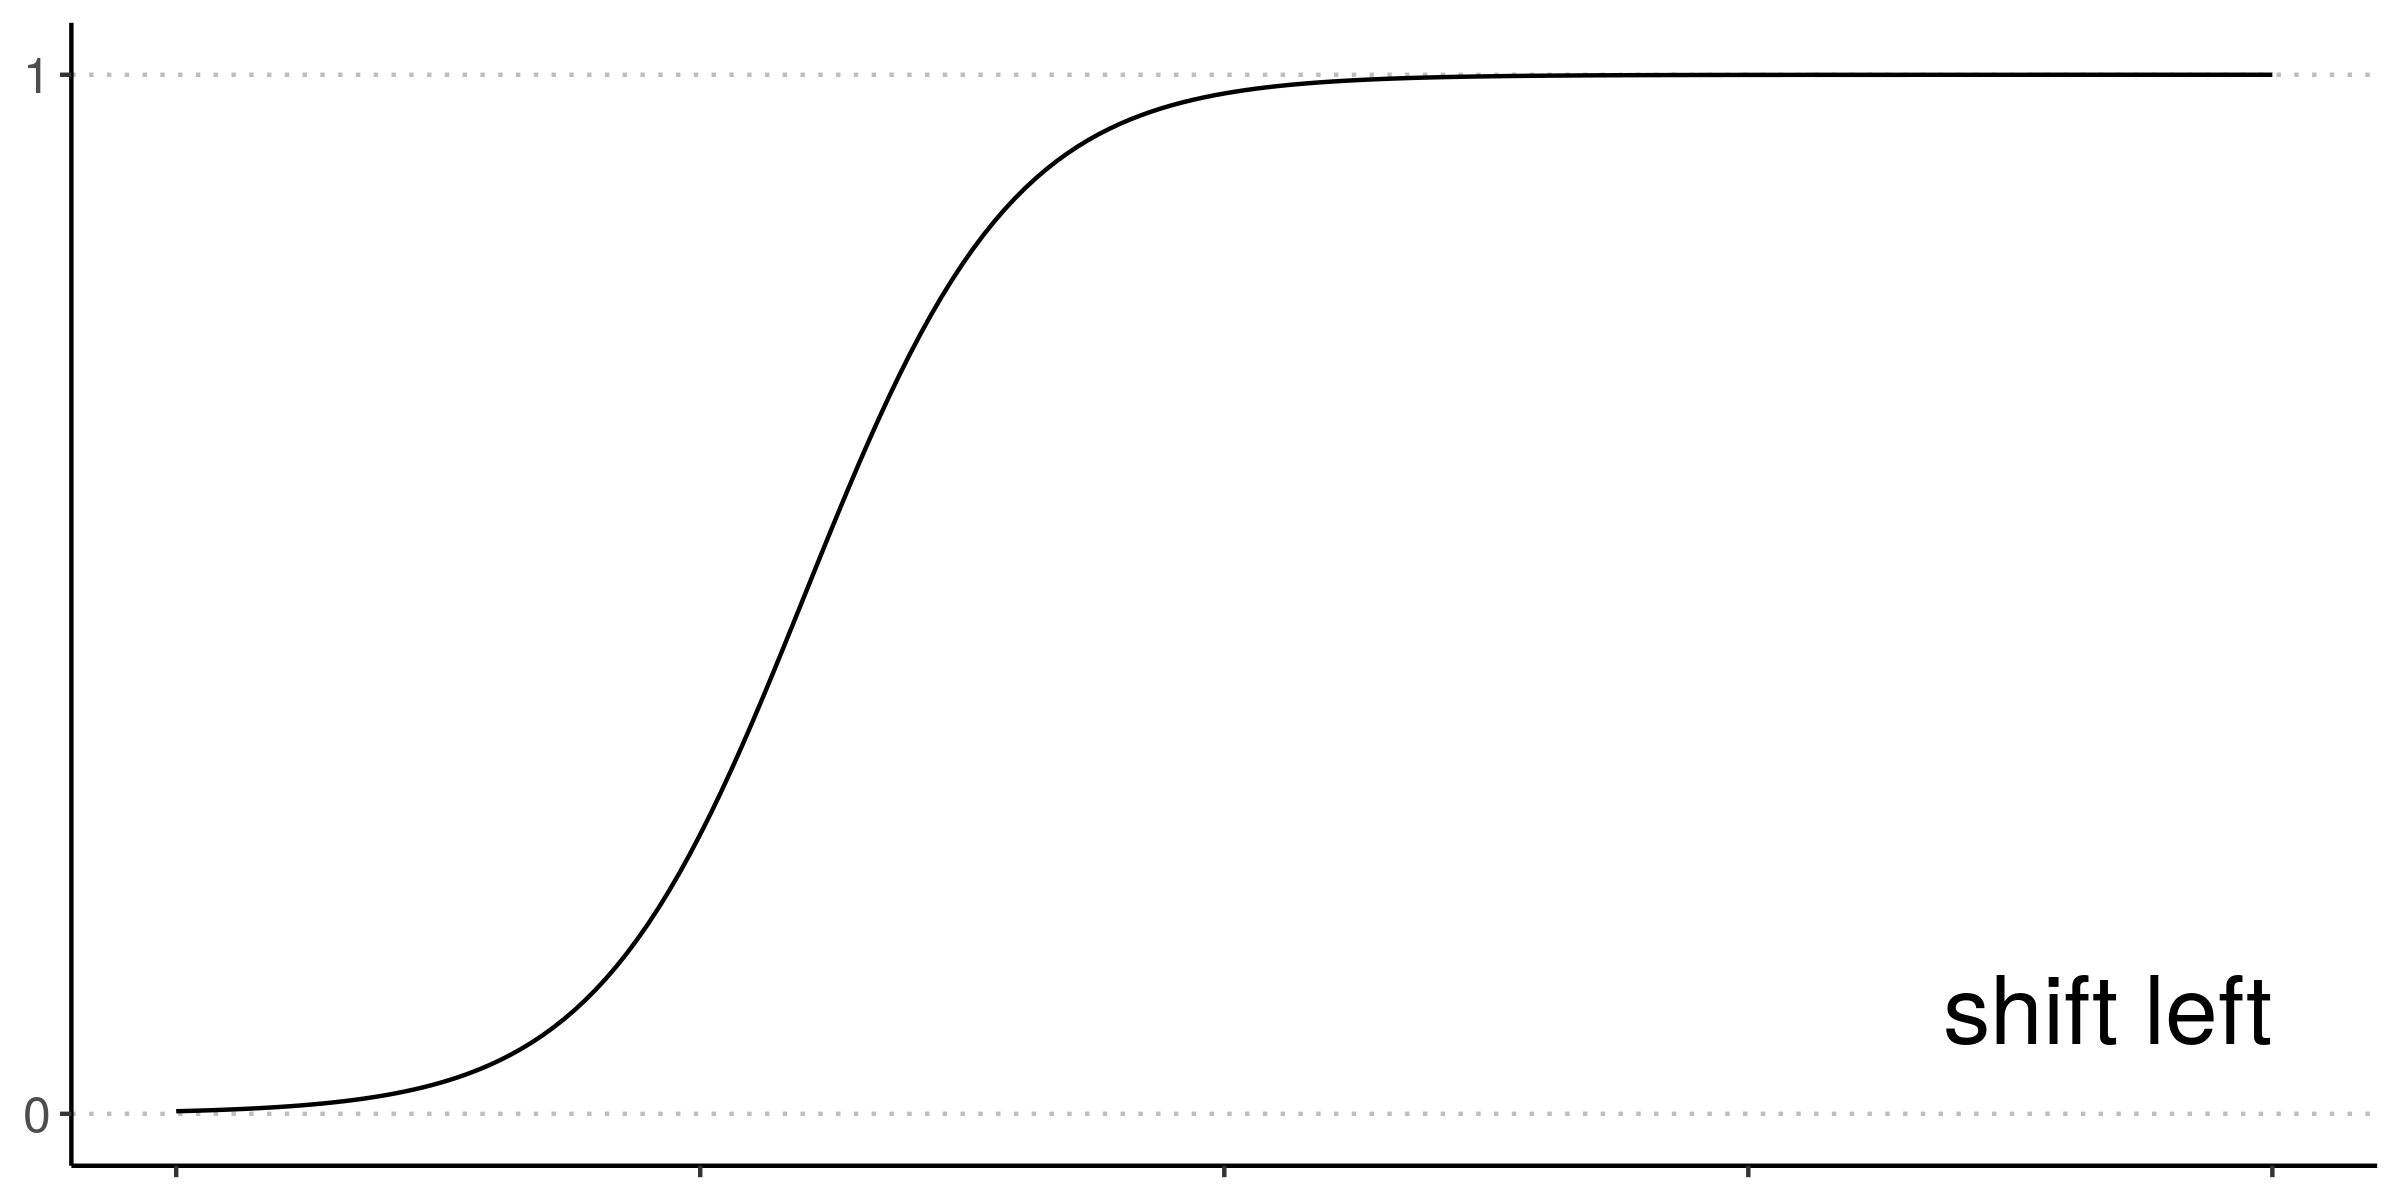
ロジスティック曲線

左にシフトしたロジスティック曲線

Machine Learning with PySpark

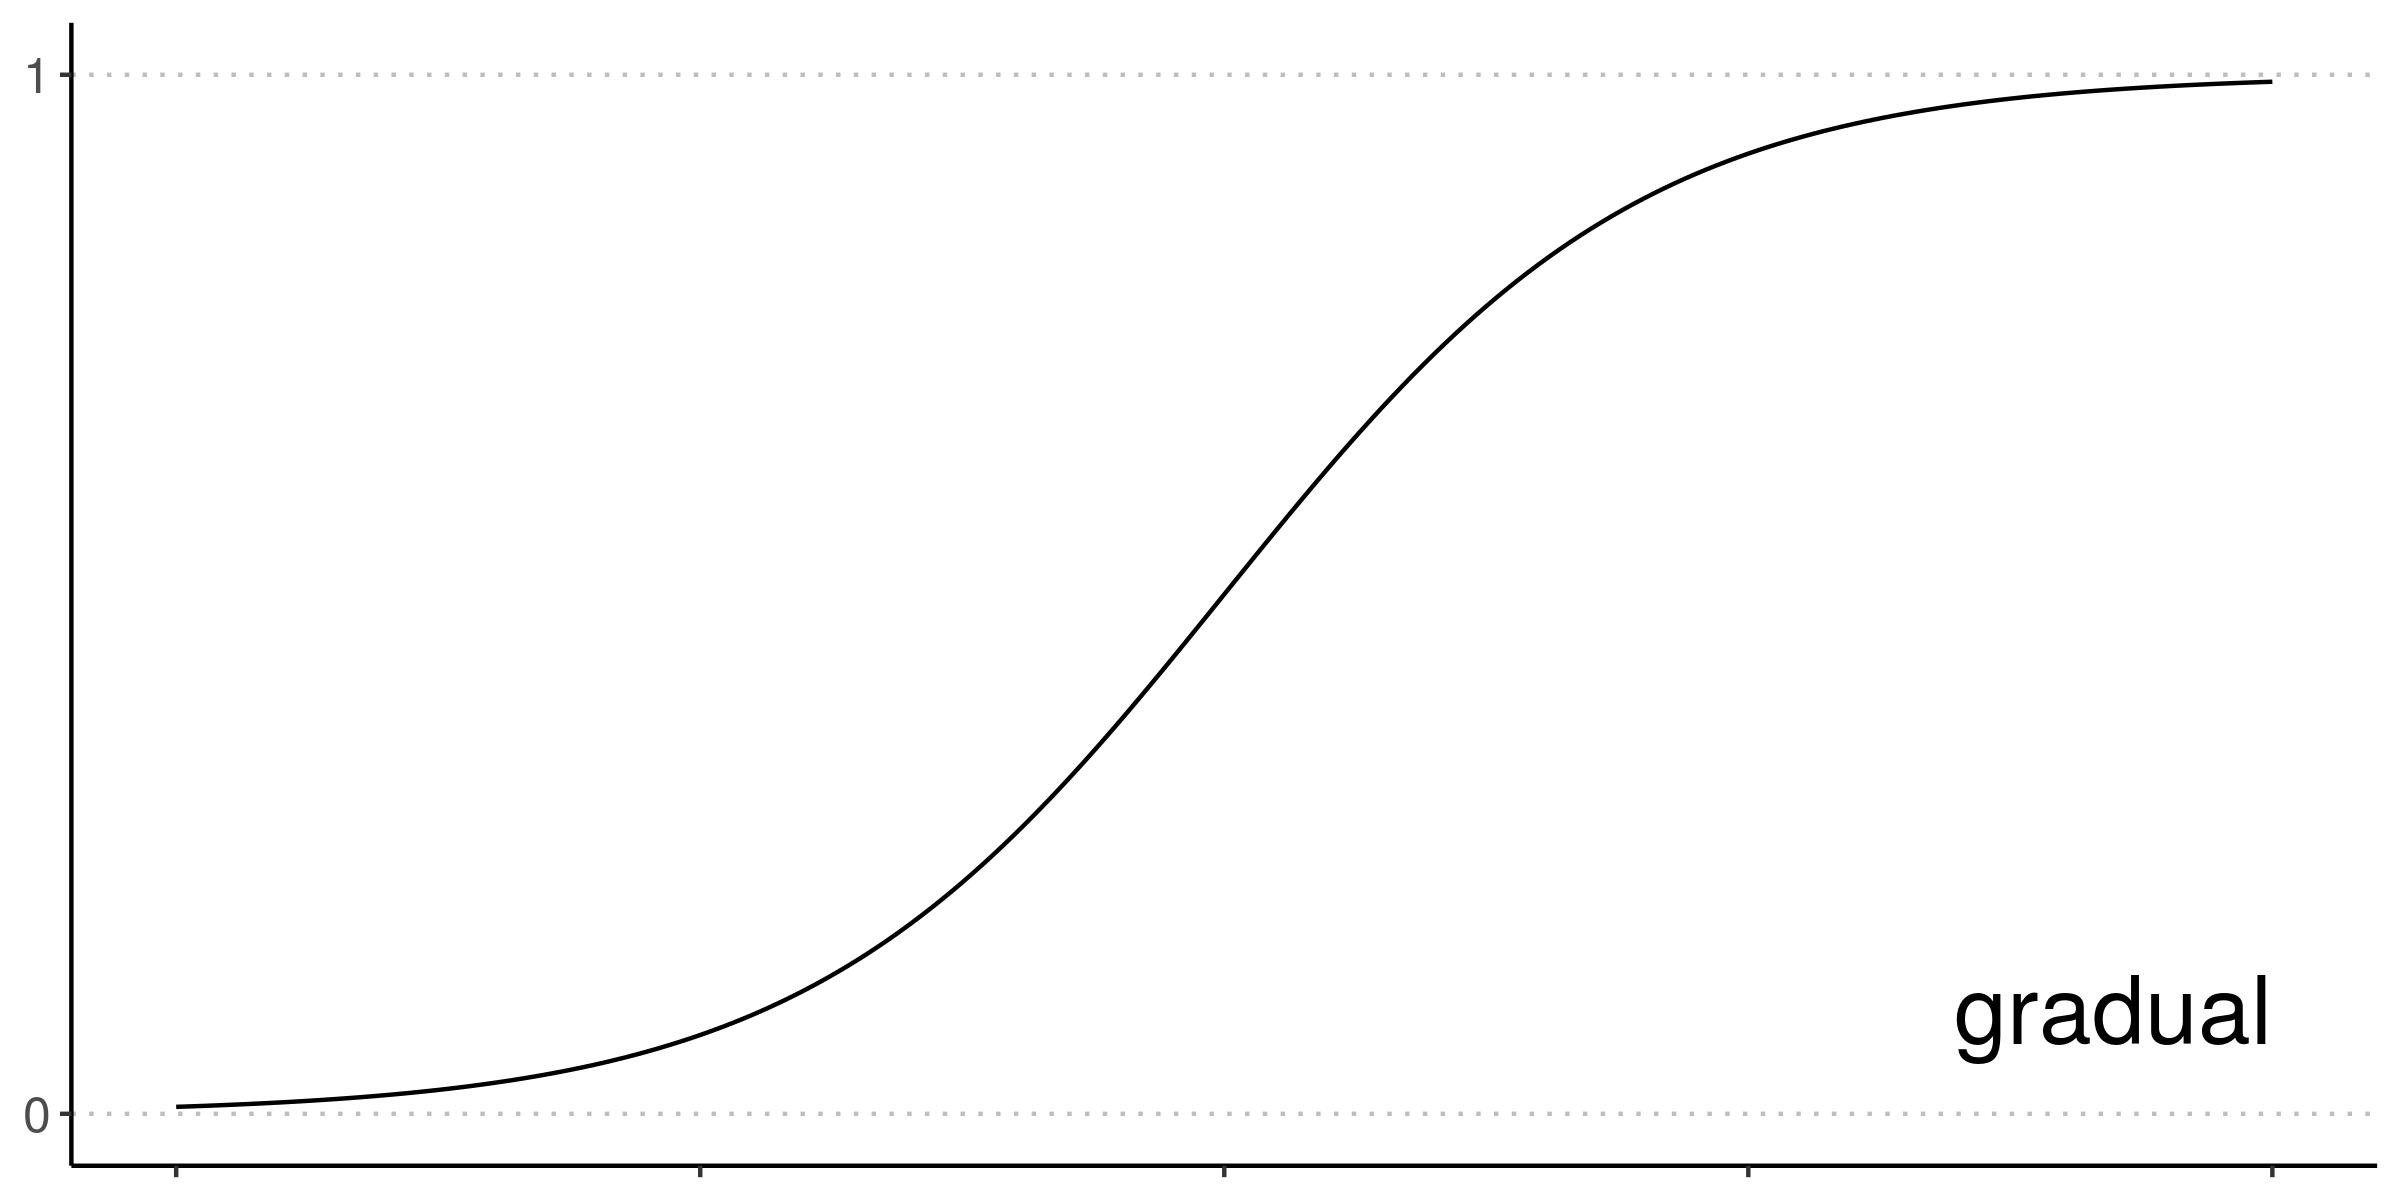
ロジスティック曲線

緩やかな遷移のロジスティック曲線

Machine Learning with PySpark

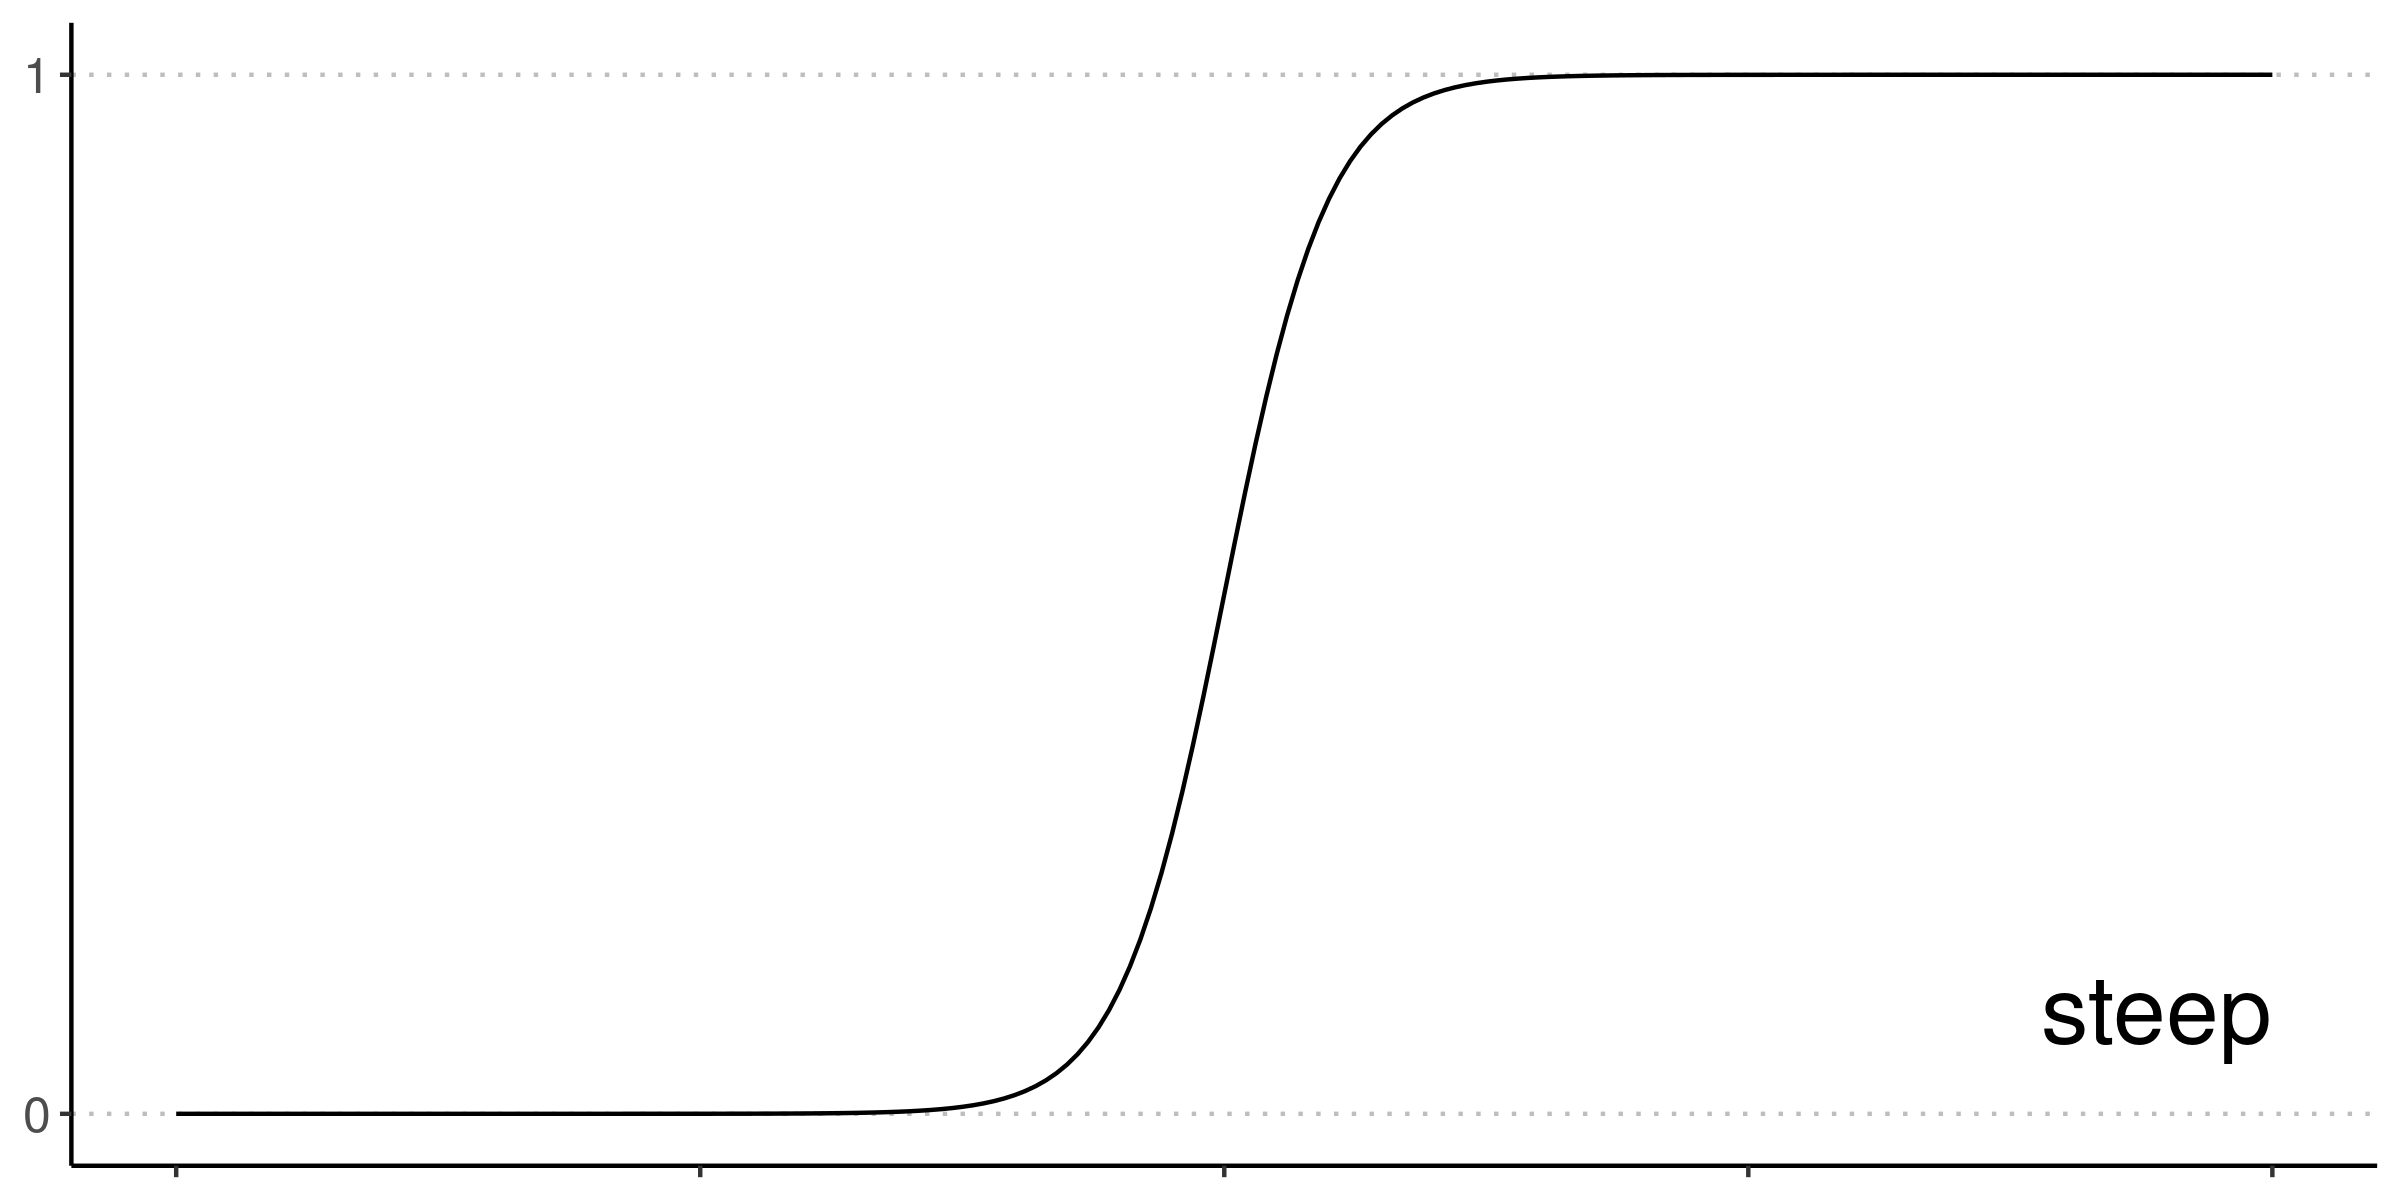
ロジスティック曲線

急峻な遷移のロジスティック曲線

Machine Learning with PySpark

自動車データを再訪

モデリング前の準備:

  • 予測変数を1列(features)にまとめる
  • データを学習用とテスト用に分割
+---+----+------+------+----+-----------+----------------------------------+-----+
|cyl|size|mass  |length|rpm |consumption|features                          |label|
+---+----+------+------+----+-----------+----------------------------------+-----+
|6  |3.0 |1451.0|4.775 |5200|9.05       |[6.0,3.0,1451.0,4.775,5200.0,9.05]|1.0  |
|4  |2.2 |1129.0|4.623 |5200|6.53       |[4.0,2.2,1129.0,4.623,5200.0,6.53]|0.0  |
|4  |2.2 |1399.0|4.547 |5600|7.84       |[4.0,2.2,1399.0,4.547,5600.0,7.84]|1.0  |
|4  |1.8 |1147.0|4.343 |6500|7.84       |[4.0,1.8,1147.0,4.343,6500.0,7.84]|0.0  |
|4  |1.6 |1111.0|4.216 |5750|9.05       |[4.0,1.6,1111.0,4.216,5750.0,9.05]|0.0  |
+---+----+------+------+----+-----------+----------------------------------+-----+
Machine Learning with PySpark

ロジスティック回帰モデルの構築

from pyspark.ml.classification import LogisticRegression

ロジスティック回帰分類器を作成します。

logistic = LogisticRegression()

学習データで学習します。

logistic = logistic.fit(cars_train)
Machine Learning with PySpark

予測

prediction = logistic.transform(cars_test)
+-----+----------+---------------------------------------+
|label|prediction|probability                            |
+-----+----------+---------------------------------------+
|0.0  |0.0       |[0.8683802216422138,0.1316197783577862]|
|0.0  |1.0       |[0.1343792056399585,0.8656207943600416]|
|0.0  |0.0       |[0.9773546766387631,0.0226453233612368]|
|1.0  |1.0       |[0.0170508265586195,0.9829491734413806]|
|1.0  |0.0       |[0.6122241729292978,0.3877758270707023]|
+-----+----------+---------------------------------------+
Machine Learning with PySpark

適合率と再現率

テストデータでの性能は?

混同行列を確認します。

+-----+----------+-----+
|label|prediction|count|
+-----+----------+-----+
|  1.0|       1.0|    8| - TP(真陽性)
|  0.0|       1.0|    4| - FP(偽陽性)
|  1.0|       0.0|    2| - FN(偽陰性)
|  0.0|       0.0|   10| - TN(真陰性)
+-----+----------+-----+
# Precision (positive)
TP / (TP + FP)
0.6666666666666666
# Recall (positive)
TP / (TP + FN)
0.8
Machine Learning with PySpark

重み付き指標

from pyspark.ml.evaluation import MulticlassClassificationEvaluator

evaluator = MulticlassClassificationEvaluator()

evaluator.evaluate(prediction, {evaluator.metricName: 'weightedPrecision'})
0.7638888888888888

他の指標:

  • weightedRecall
  • accuracy
  • f1
Machine Learning with PySpark

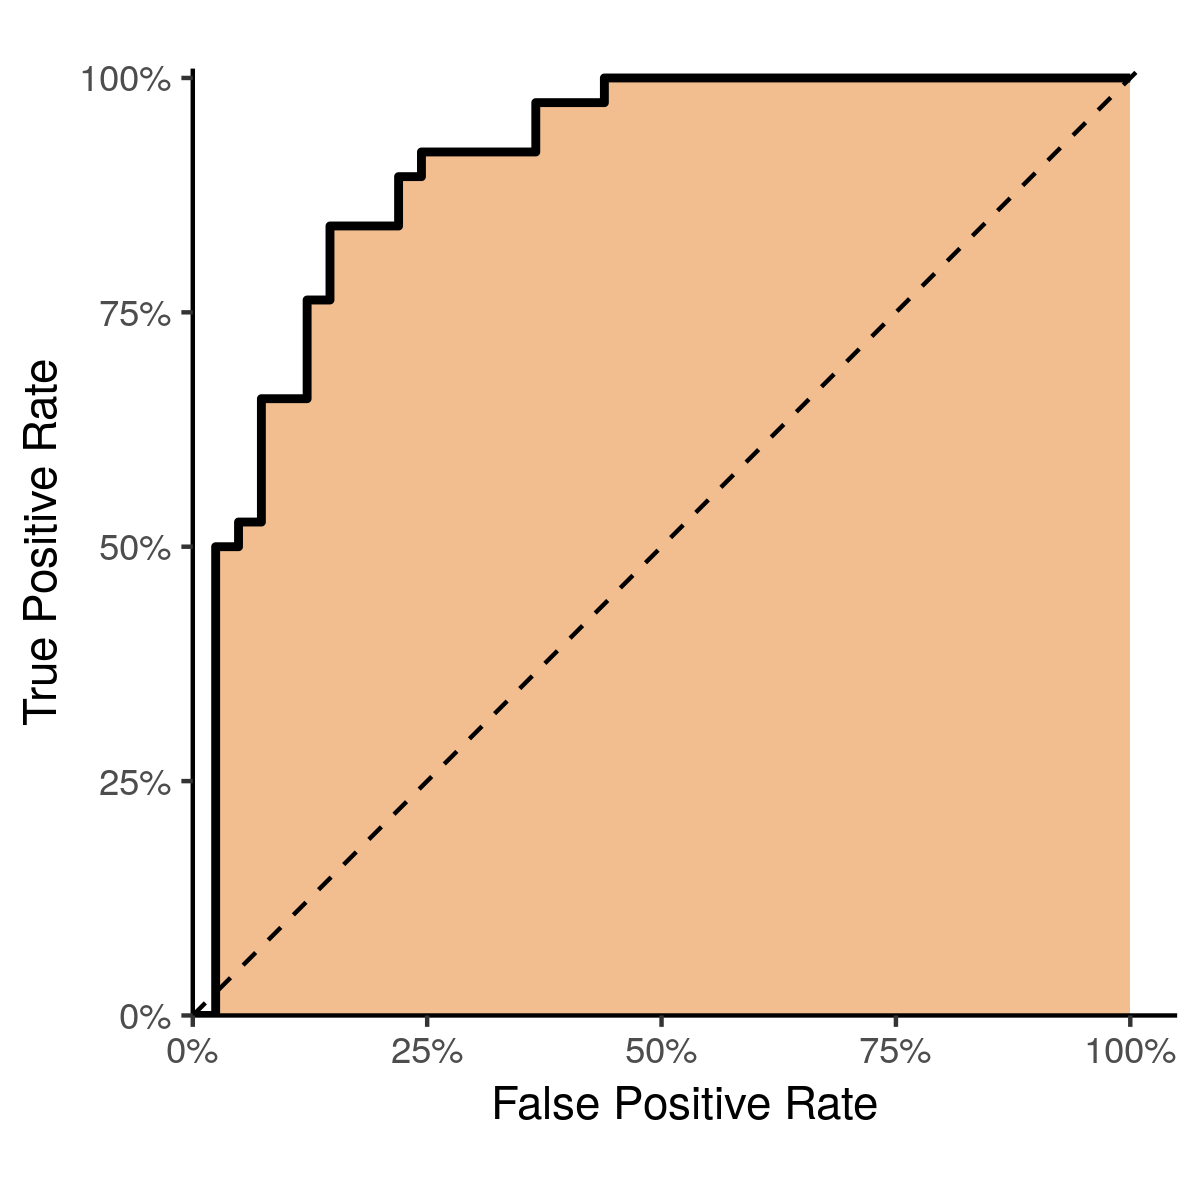
ROC と AUC

ROC 曲線

ROC = 「受信者動作特性」

  • TP と FP
  • しきい値 = 0(右上)
  • しきい値 = 1(左下)

AUC = 「曲線下面積」

  • 理想的には AUC = 1
Machine Learning with PySpark

ロジスティック回帰をやってみましょう!

Machine Learning with PySpark

Preparing Video For Download...