Dashコンポーネントの配置

Dash と Plotly で作るダッシュボード

Alex Scriven

Data Scientist

HTMLとウェブ


HTML:ウェブサイト構造の言語

  • HTML:家の骨組み
    • オブジェクトの配置を決める
  • CSS:部屋の塗装色
    • オブジェクトのスタイル(例:背景色)

公式HTMLロゴ。青い文字でHTMLと書かれている

公式CSSロゴ。青いエンボス文字でcssと書かれている

Dash と Plotly で作るダッシュボード

DivタグとHタグ


  • Dashはdash.htmlでHTMLとPythonをつなぐ

$$

重要なHTML構造(タグ):

  • Divタグ:サイト構造に重要
    • さまざまな大きさのdivに中身を入れられる
  • Hタグ:見出しサイズ(H1 > H6)
Dash と Plotly で作るダッシュボード

DivとHタグの使用


$$

  • 全体のdiv(すべてを内包)
  • 内側のdiv:赤い背景
  • 青い背景のdiv
    • 中にHタグ
  • styleは無視——CSSは後で解説


<div>
  <div style="background-color: red; 
              width:250; height:250;">
  </div>
  <div style="background-color: lightblue; 
              width:250; height:250;">
    <h1>This box</h1>
    <h2>Another Title</h2>
  </div>
</div>
Dash と Plotly で作るダッシュボード

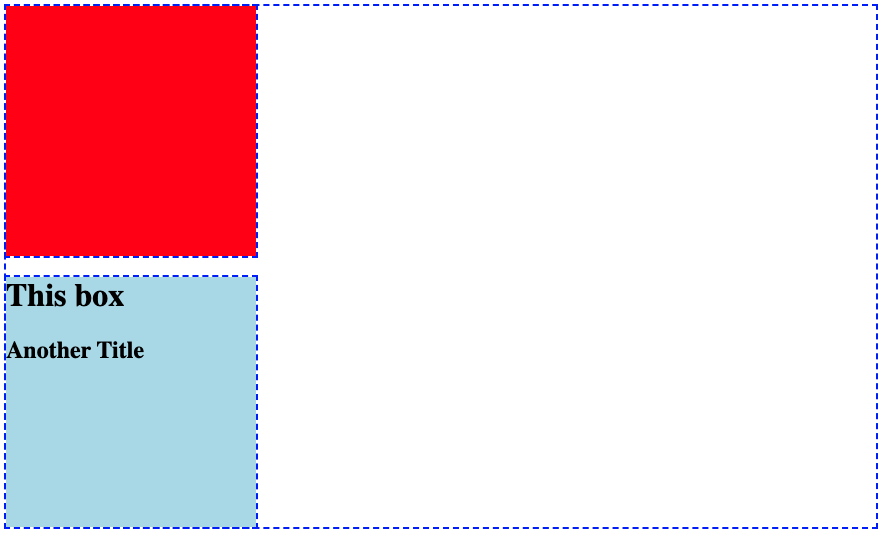
表示例


点線の枠の青いボックス画像。左上に赤い塗りつぶしの小ボックス。下に水色のボックスがあり「This box」「another title」の文字


注目ポイント:

  • 赤背景のdiv
  • Hタグ入りの青背景div
Dash と Plotly で作るダッシュボード

Dashでの例


  • DashでHTML例を再現
from dash import Dash, html
app = Dash()
app.layout = [
    html.Div(style={'height':250, 'width':250, 'background-color':'red'}),
    html.Div(children=[
        html.H1("This box"),
        html.H2("Another Title")], 
        style={'background-color':'lightblue'})
    ]
Dash と Plotly で作るダッシュボード

レイアウトの分解


  • HTMLタグはDashのhtml.()に対応
    • html.Div() = <div>
    • html.H1() = <h1>
  • 最後のdivはchildren引数を持つ
    • 中に入れるオブジェクトのリスト
  • dcc.Graph()も入れられる!


from dash import Dash, html
app.layout = [
  html.Div(
    style={'background-color':'red', 
           'height':250, 'width':250}),
  html.Div(
  children=[
      html.H1("This box"),
      html.H2("Another Title")]
    ,style={'background-color':'lightblue', 
              'height':250, 'width':250})
]
Dash と Plotly で作るダッシュボード

レイアウト内のグラフ

bar_fig_country = px.bar(ecom_sales, 
 x='Total Sales ($)', y='Country',
 color='Country', color_discrete_map=
 {'United Kingdom':'lightblue', 
 'Germany':'orange', 'France':'darkblue', 
 'Australia':'green', 'Hong Kong':'red'})
app = Dash()

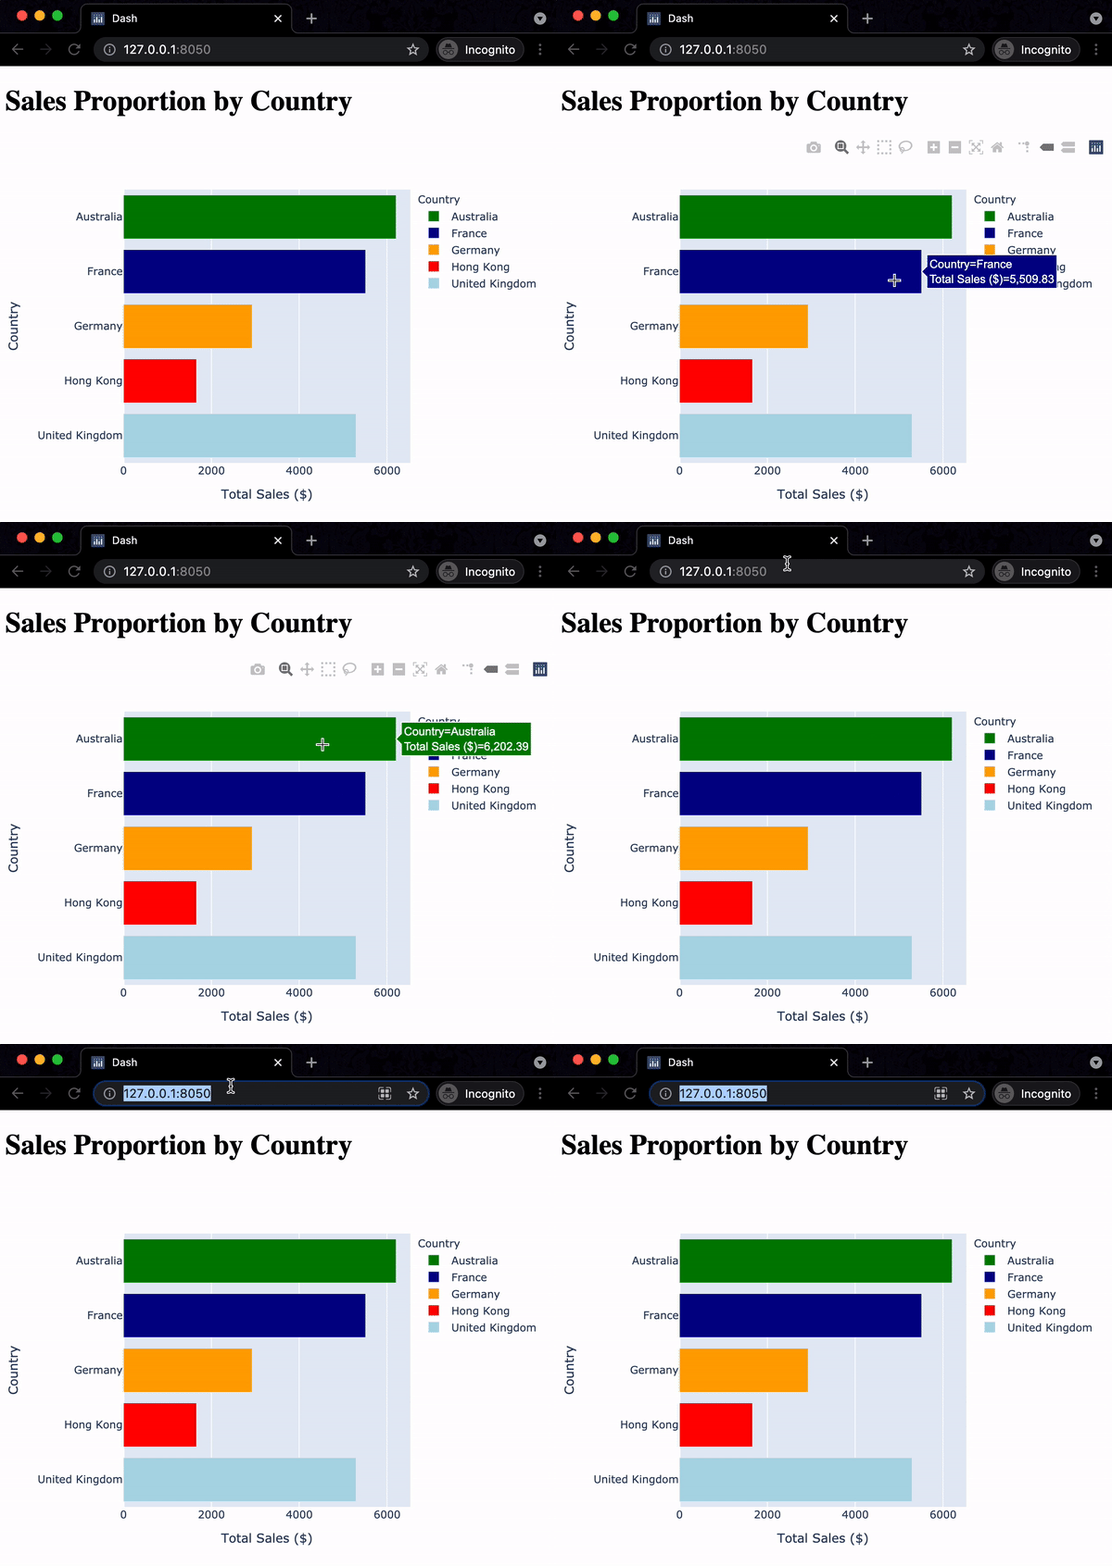
app.layout = [ html.H1("Sales Proportion by Country"), dcc.Graph(id='bar_graph', figure=bar_fig_country) ]

Chromeブラウザで、x軸に総売上、y軸に国の横棒グラフのGIF。国ごとに色が異なる。マウスがグラフ上をホバーし、その後サーバーアドレスのあるURLバーに移動する

Dash と Plotly で作るダッシュボード

構造を追加する

$$

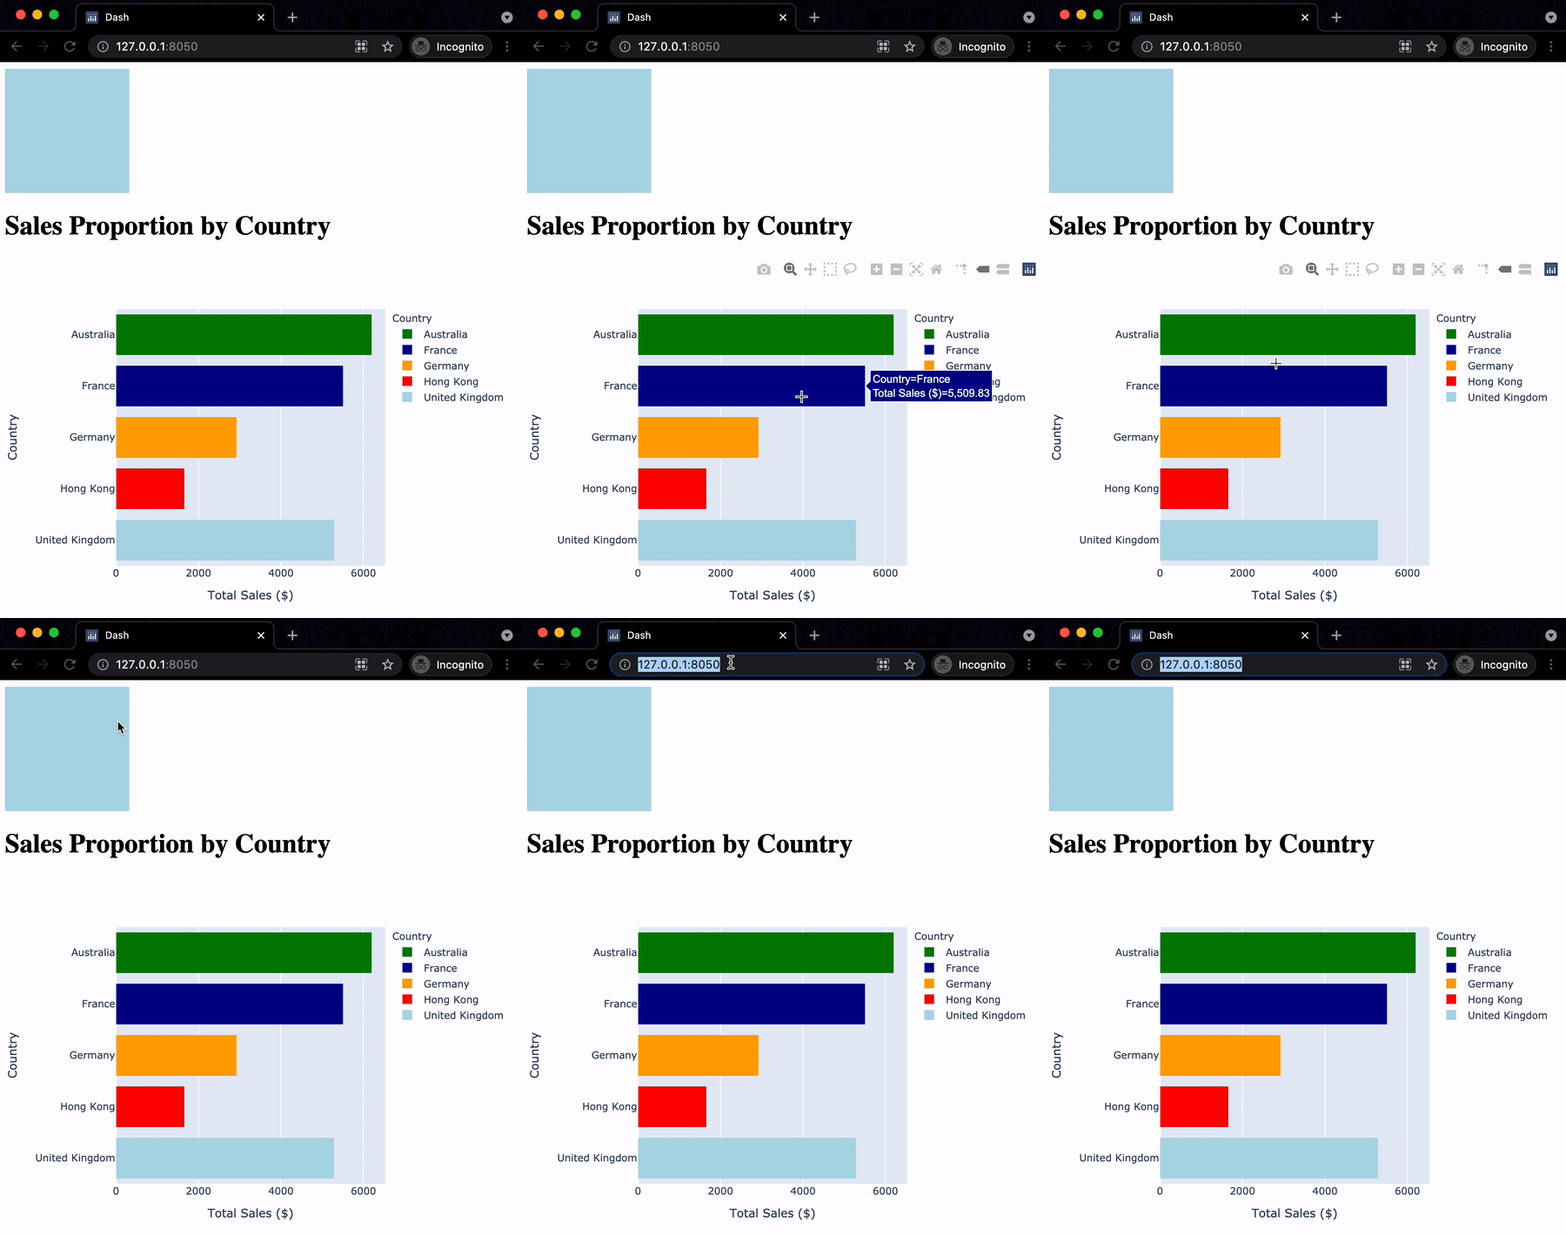
app.layout = [
  html.Div(style={
    'width':150,'height':150, 
    'background-color':'lightblue'}),
  html.H1("Sales Proportion by Country"),
  dcc.Graph(id='bar_graph', 
            figure=bar_fig_country)
]

$$

前の演習と同じアプリのGIF。棒グラフがページ下に押し下げられ、上に小さな水色のボックスがある

Dash と Plotly で作るダッシュボード

Let's practice!

Dash と Plotly で作るダッシュボード

Preparing Video For Download...