Plotly から Dash へ
Dash と Plotly で作るダッシュボード

Alex Scriven
Data Scientist
本アプリ
Google Chrome などのブラウザでアクセス
サーバー起動中に
.pyを更新・保存するとブラウザが即時反映

ブラウザでのアプリ
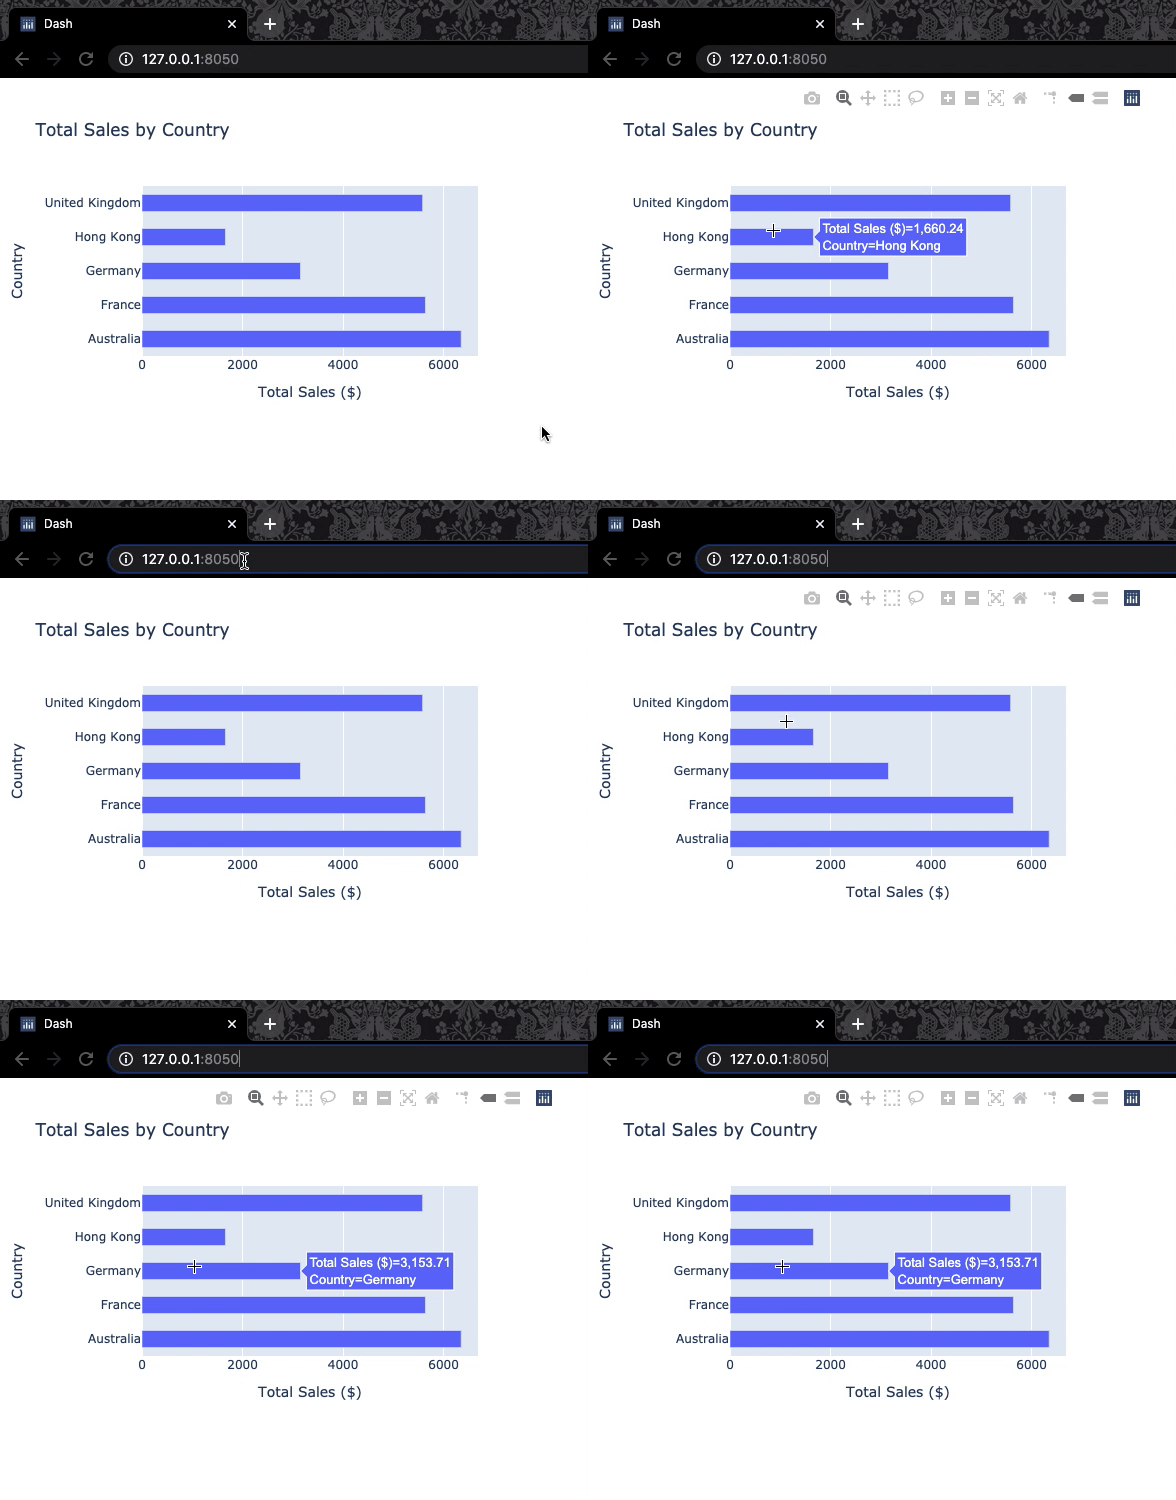
DataCamp での Dash
- 他の DataCamp 演習との差分:
- 冒頭にセットアップ行あり
- 逐次ではなく一括実行
- より長いコード
- 完全動作のダッシュボード(ウィンドウを拡大して確認)

Dash と Plotly で作るダッシュボード
Alex Scriven
Data Scientist
Google Chrome などのブラウザでアクセス
サーバー起動中に .py を更新・保存するとブラウザが即時反映

