料理を探索する

Rで作るShiny Webアプリケーション

Ramnath Vaidyanathan

VP of Product Research

データを探索する
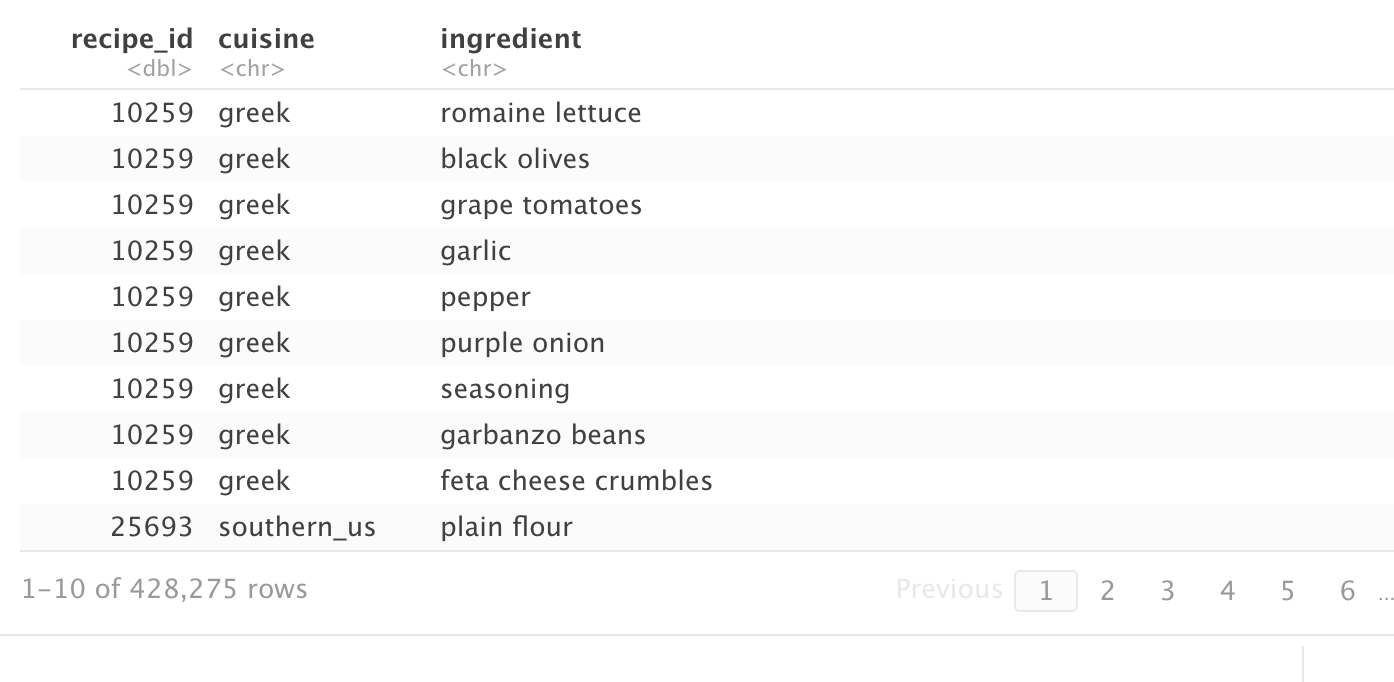
cuisines データセットの先頭10行を示す表

Rで作るShiny Webアプリケーション

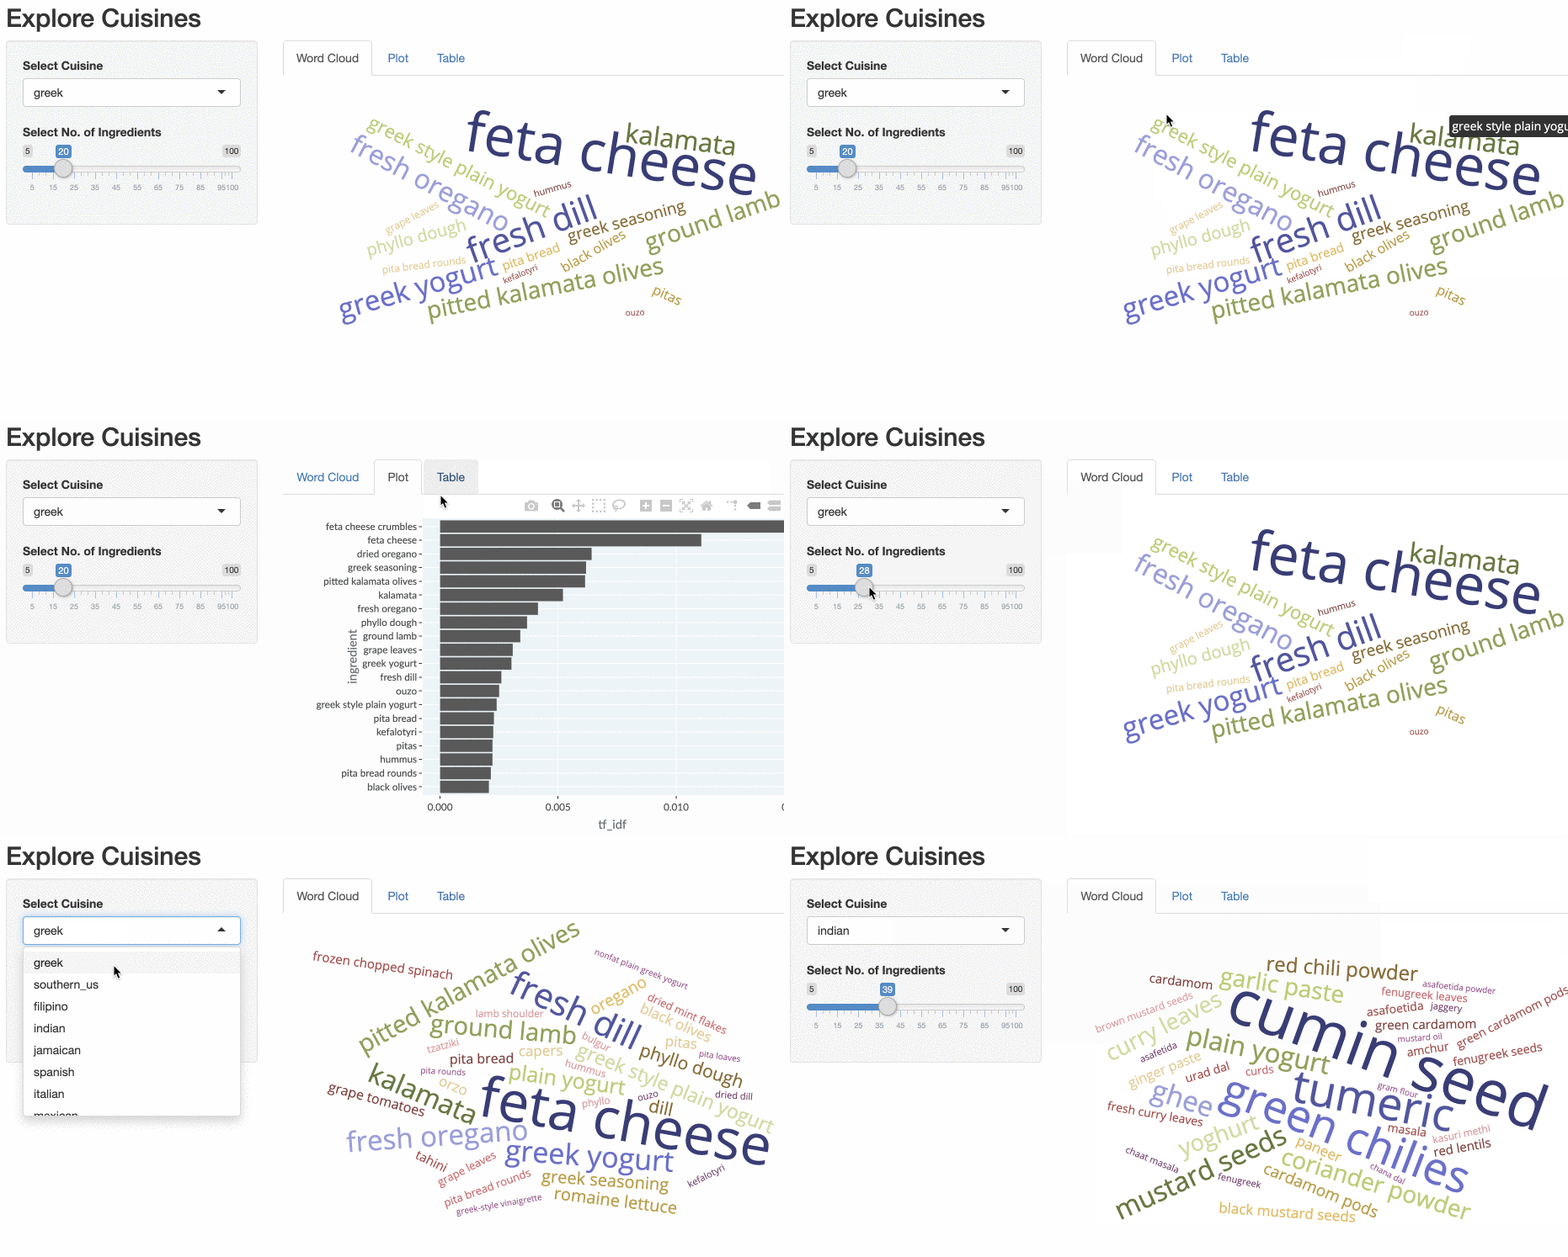
アプリのプレビューを示すGIF

Rで作るShiny Webアプリケーション
ui <- fluidPage(
  titlePanel('Explore Cuisines'),
  sidebarLayout(
    sidebarPanel(

selectInput('cuisine', 'Select Cuisine', unique(recipes$cuisine)),
sliderInput('nb_ingredients', 'Select No. of Ingredients', 5, 100, 20),
), mainPanel( tabsetPanel(
tabPanel('Word Cloud', d3wordcloudOutput('wc_ingredients')),
tabPanel('Plot', plotly::plotlyOutput('plot_top_ingredients')),
tabPanel('Table', DT::DTOutput('dt_top_ingredients'))
) ) ) )
Rで作るShiny Webアプリケーション

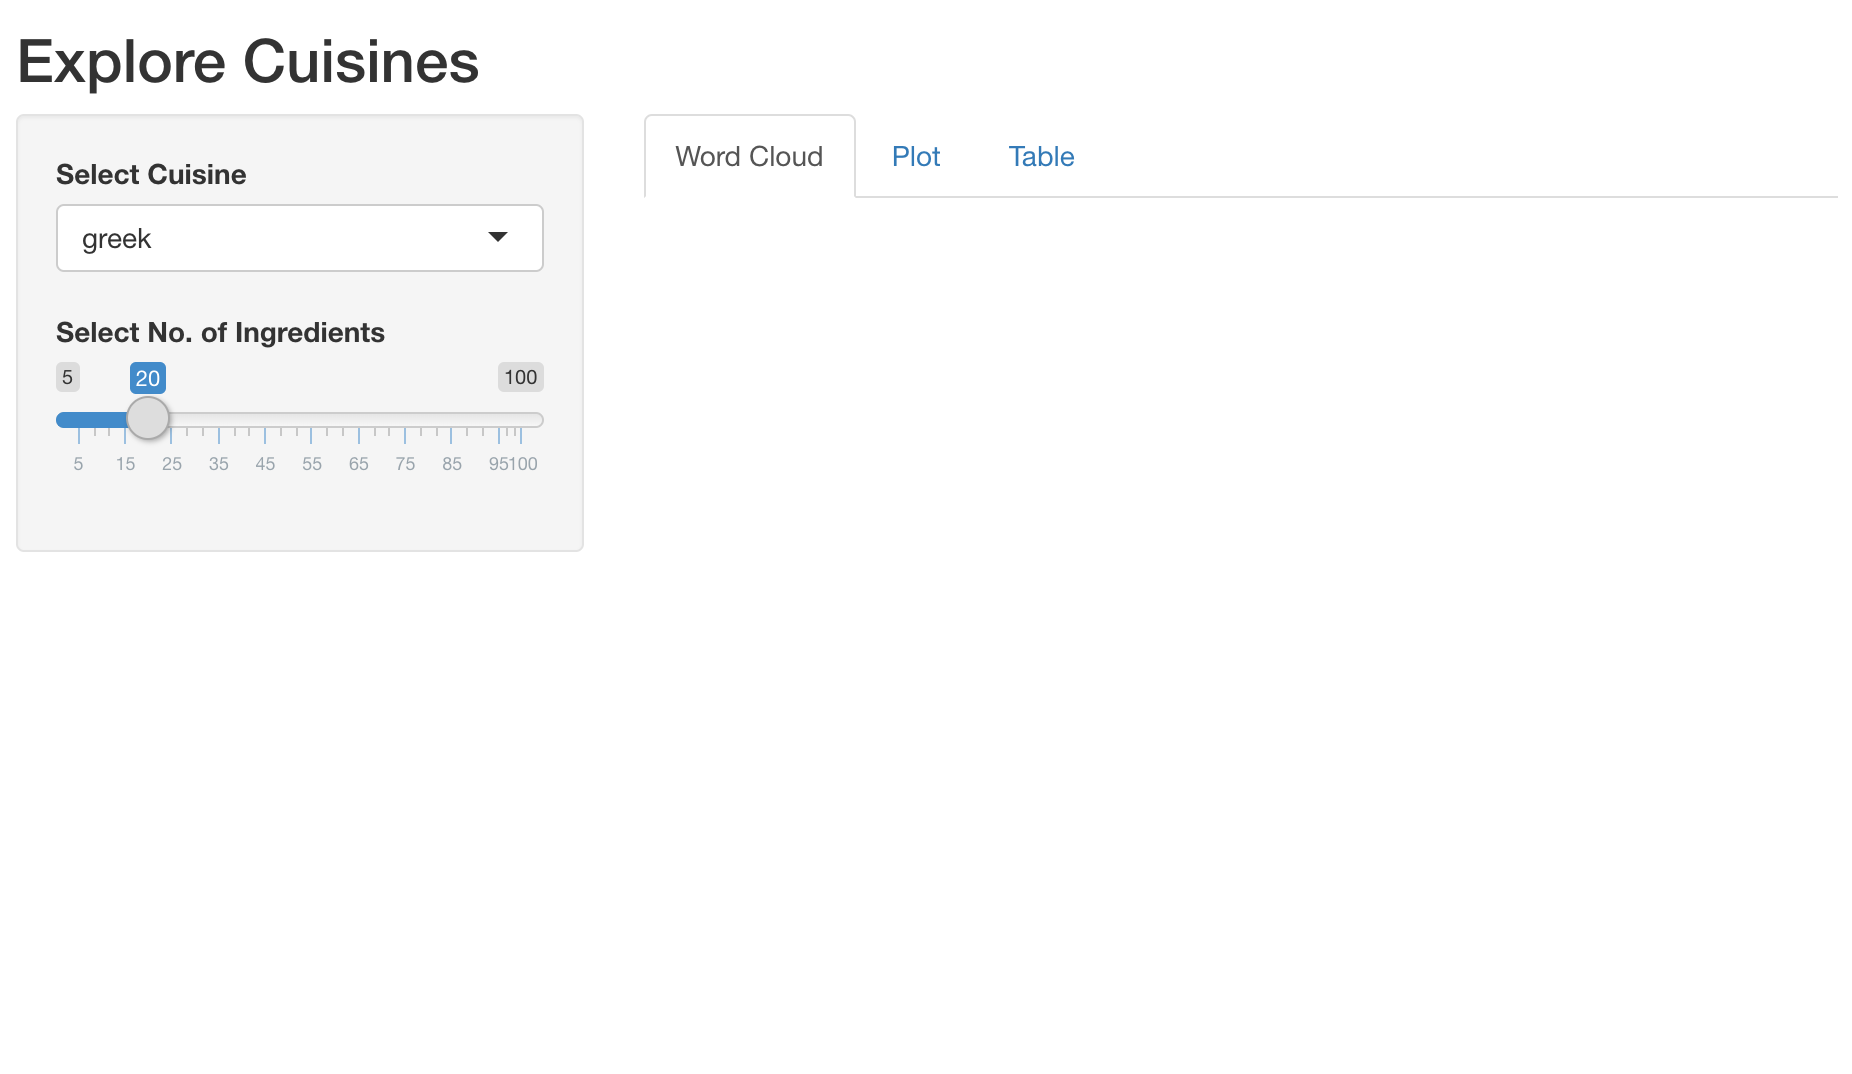
料理を選ぶドロップダウン、食材数のスライダー、出力タブを備えたアプリ

Rで作るShiny Webアプリケーション

出力を追加:対話型テーブル

output$dt_top_ingredients <- DT::renderDT({

recipes %>%
filter(cuisine == input$cuisine) %>%
count(ingredient, name = 'nb_recipes') %>%
arrange(desc(nb_recipes)) %>%
head(input$nb_ingredients)
})
Rで作るShiny Webアプリケーション

TF-IDF を計算する

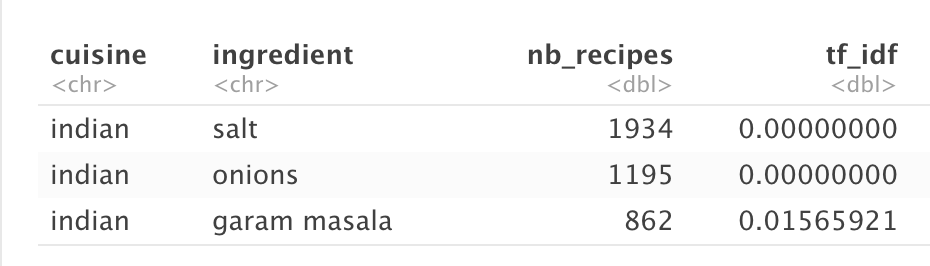
使用レシピ数に基づくインド料理の上位3食材を示す表

recipes_enriched <- recipes %>%

count(cuisine, ingredient, name = 'nb_recipes') %>%
tidytext::bind_tf_idf(ingredient, cuisine, nb_recipes)
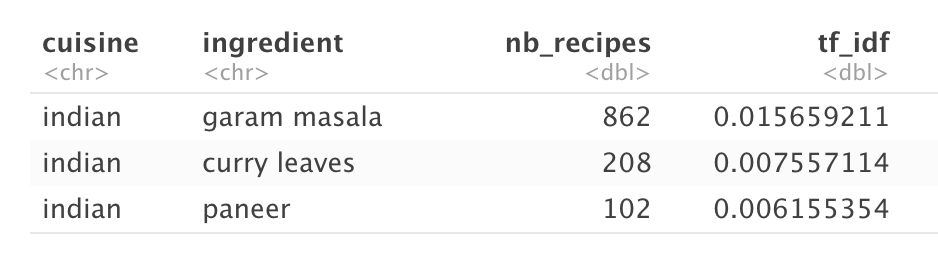
TF-IDFに基づくインド料理の上位3食材を示す表

Rで作るShiny Webアプリケーション

リアクティブ式を追加する

  rval_top_ingredients <- reactive({

recipes_enriched %>%
filter(cuisine == input$cuisine) %>%
arrange(desc(tf_idf)) %>%
head(input$nb_ingredients) %>%
mutate(ingredient = forcats::fct_reorder(ingredient, tf_idf))
})
Rで作るShiny Webアプリケーション

出力を追加:対話型プロットとワードクラウド

output$plot_top_ingredients <- plotly::renderPlotly({
  rval_top_ingredients() %>%
    ggplot(aes(x = ingredient, y = tf_idf)) +
    geom_col() +
    coord_flip()
})
output$wc_ingredients <- d3wordcloud::renderD3wordcloud({
  d <- rval_top_ingredients()
  d3wordcloud(d$ingredient, d$nb_recipes, tooltip = TRUE)
})
Rで作るShiny Webアプリケーション

最終アプリのプレビューを示すGIF

Rで作るShiny Webアプリケーション

Passons à la pratique !

Rで作るShiny Webアプリケーション

Preparing Video For Download...