アプリを作る

Rで作るShiny Webアプリケーション

Kaelen Medeiros

Data Scientist

平均寿命 vs. 一人当たりGDPを探索

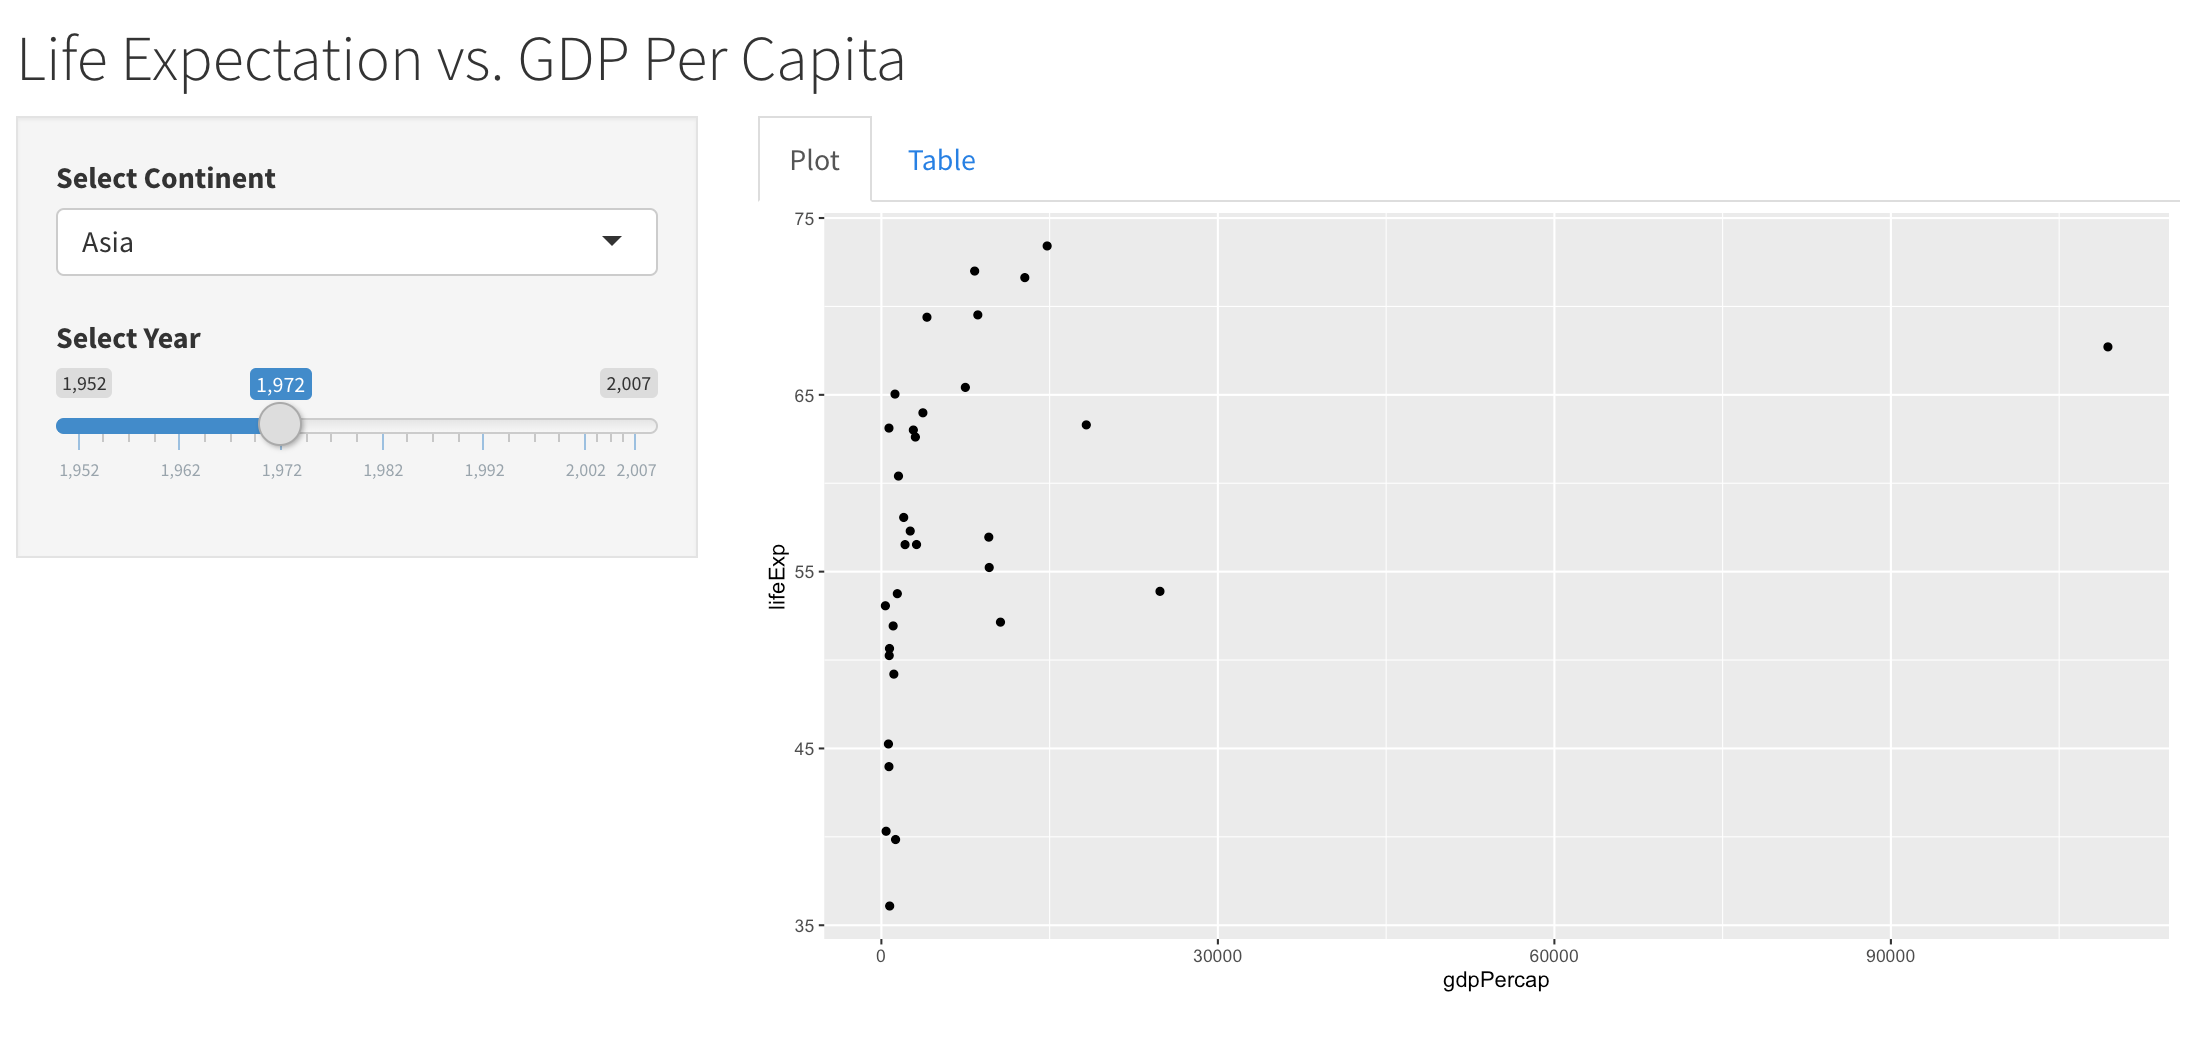
選択した大陸と年の、平均寿命と一人当たりGDPのインタラクティブな散布図を表示するアプリ

Rで作るShiny Webアプリケーション

平均寿命 vs. 一人当たりGDPを探索

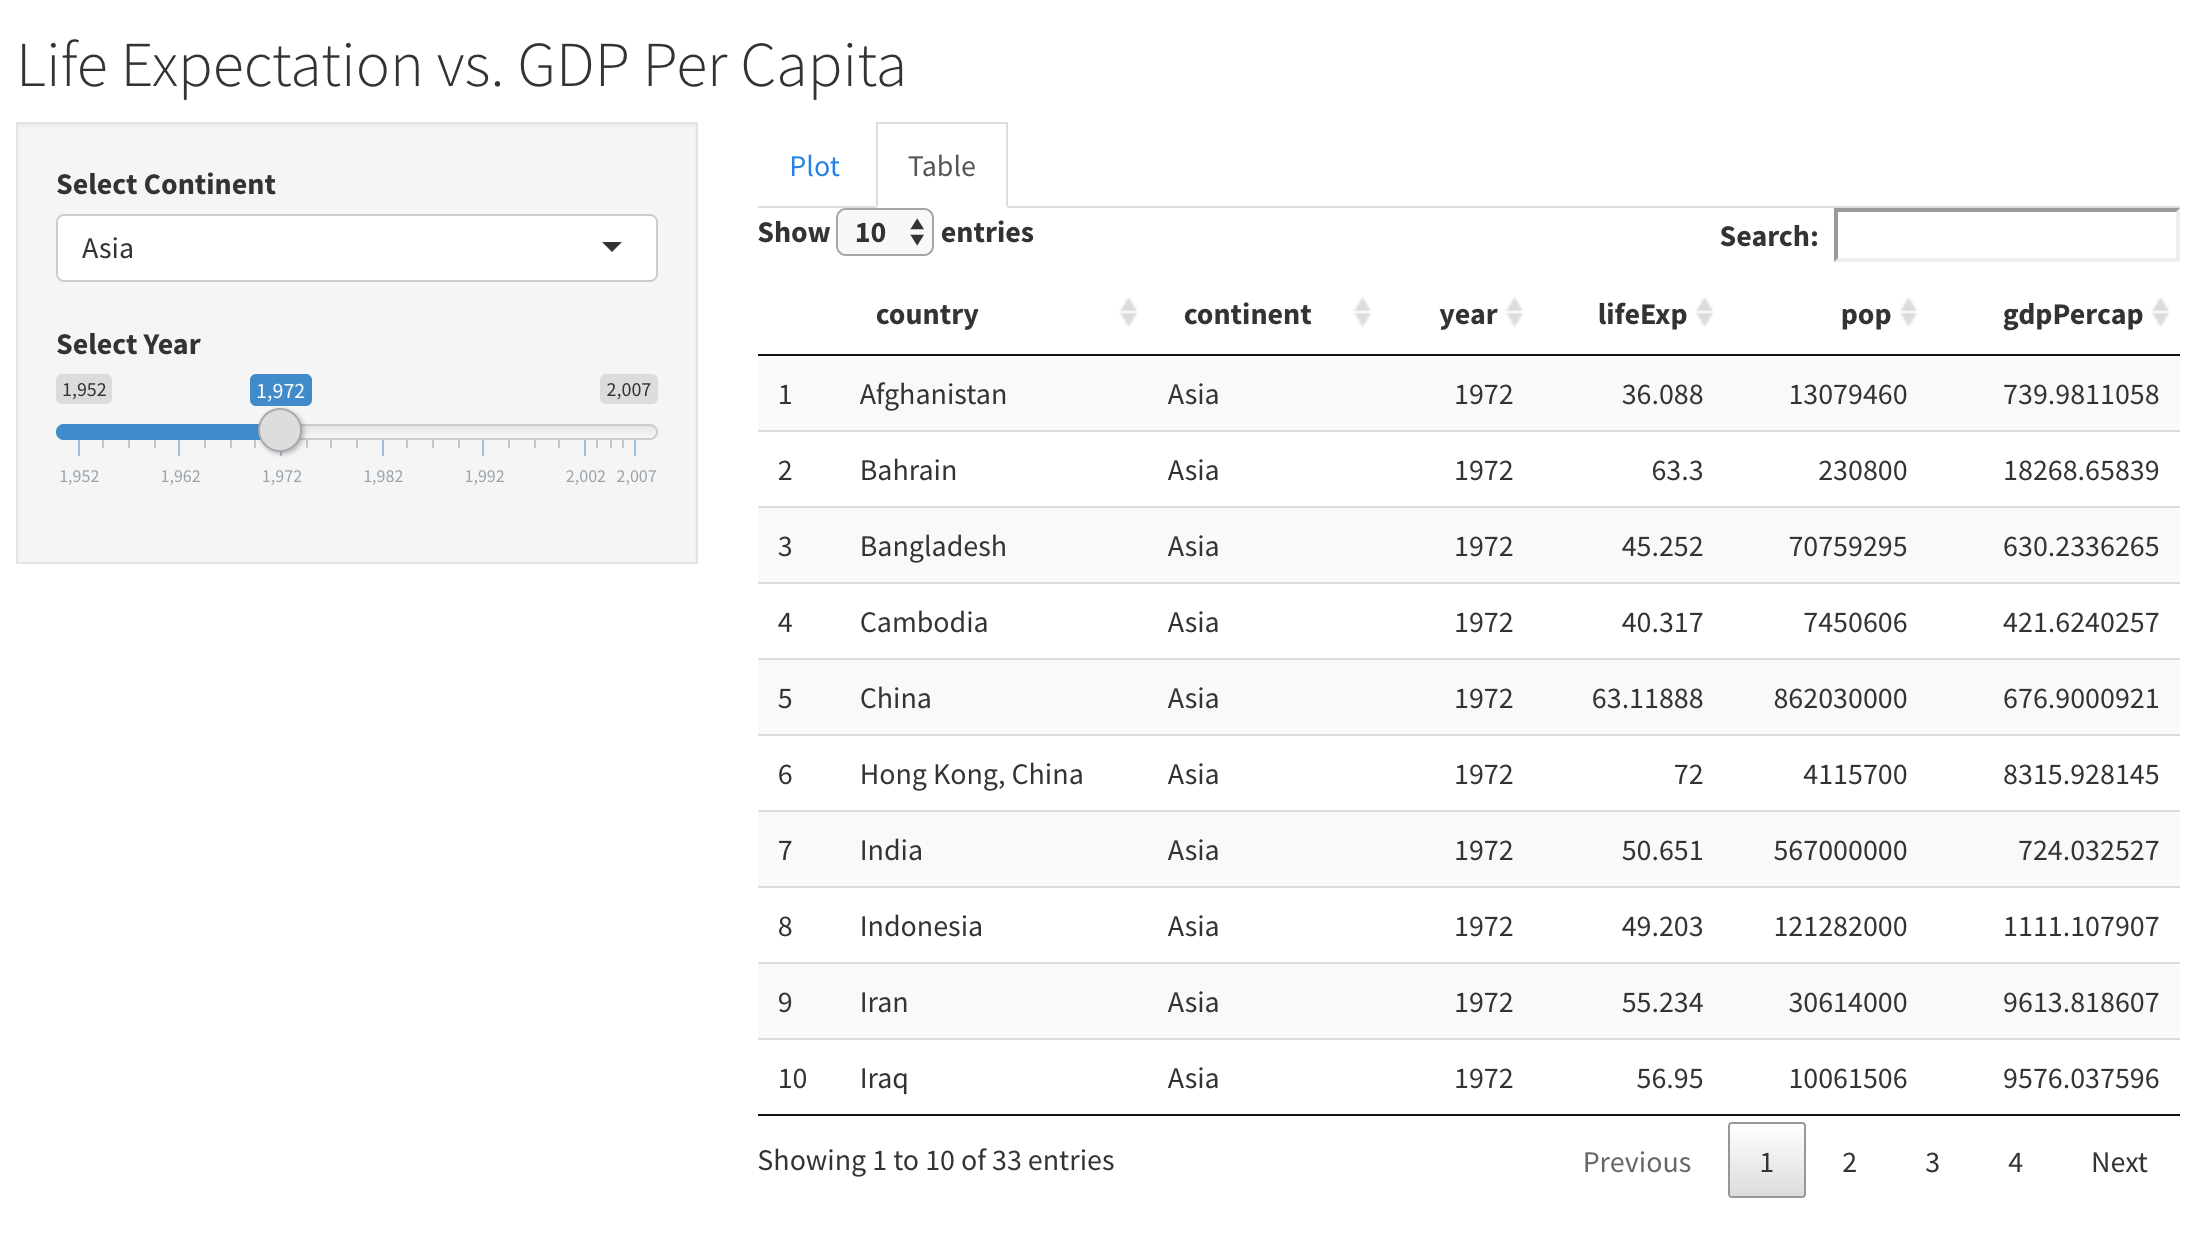
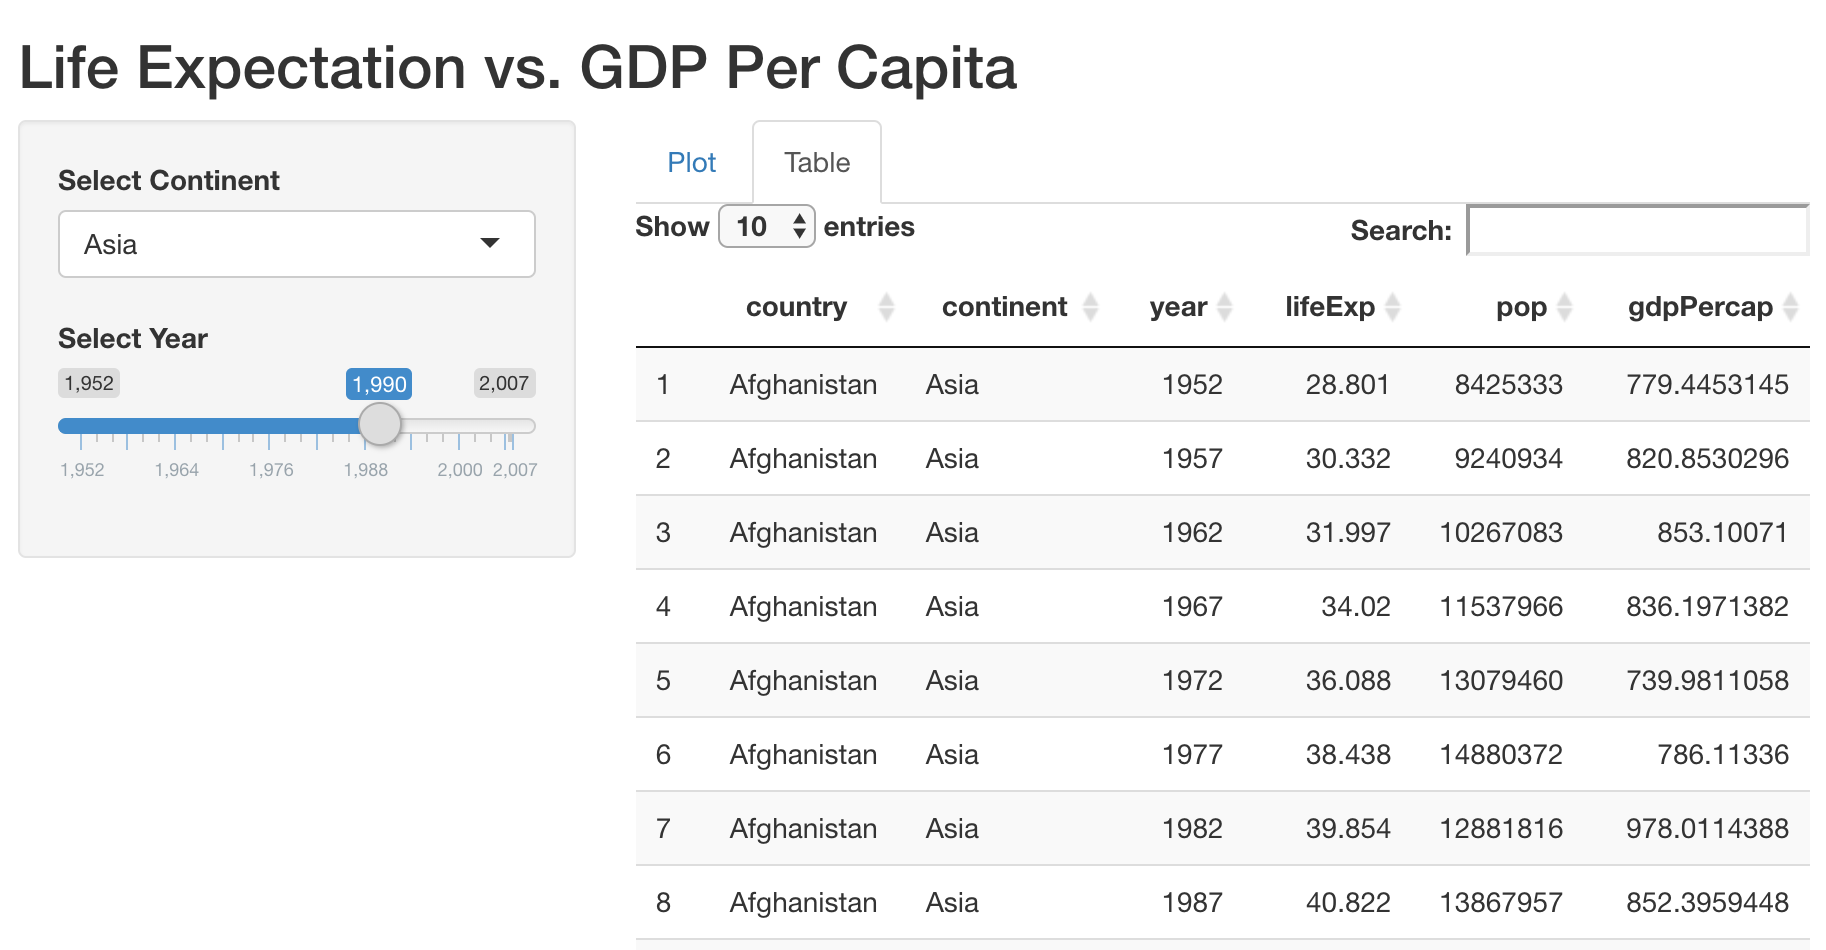
選択した大陸と年の、平均寿命・人口・一人当たりGDPのインタラクティブな表を表示するアプリ

Rで作るShiny Webアプリケーション

Shinyアプリ構築:4つの手順

  1. 入力を追加(UI)
  2. 出力を追加(UI/サーバー)
  3. レイアウトを更新(UI)
  4. 出力を更新(サーバー)
Rで作るShiny Webアプリケーション

ステップ1:入力を追加(UI)

ui <- fluidPage(
  titlePanel("Life Expectation vs. GDP Per Capita"),

selectInput('continent', 'Select Continent', unique(gapminder$continent)),
sliderInput('year', 'Select Year', 1952, 2007, 1990, step = 5) )
server <- function(input, output, session){ } shinyApp(ui = ui, server = server)
Rで作るShiny Webアプリケーション

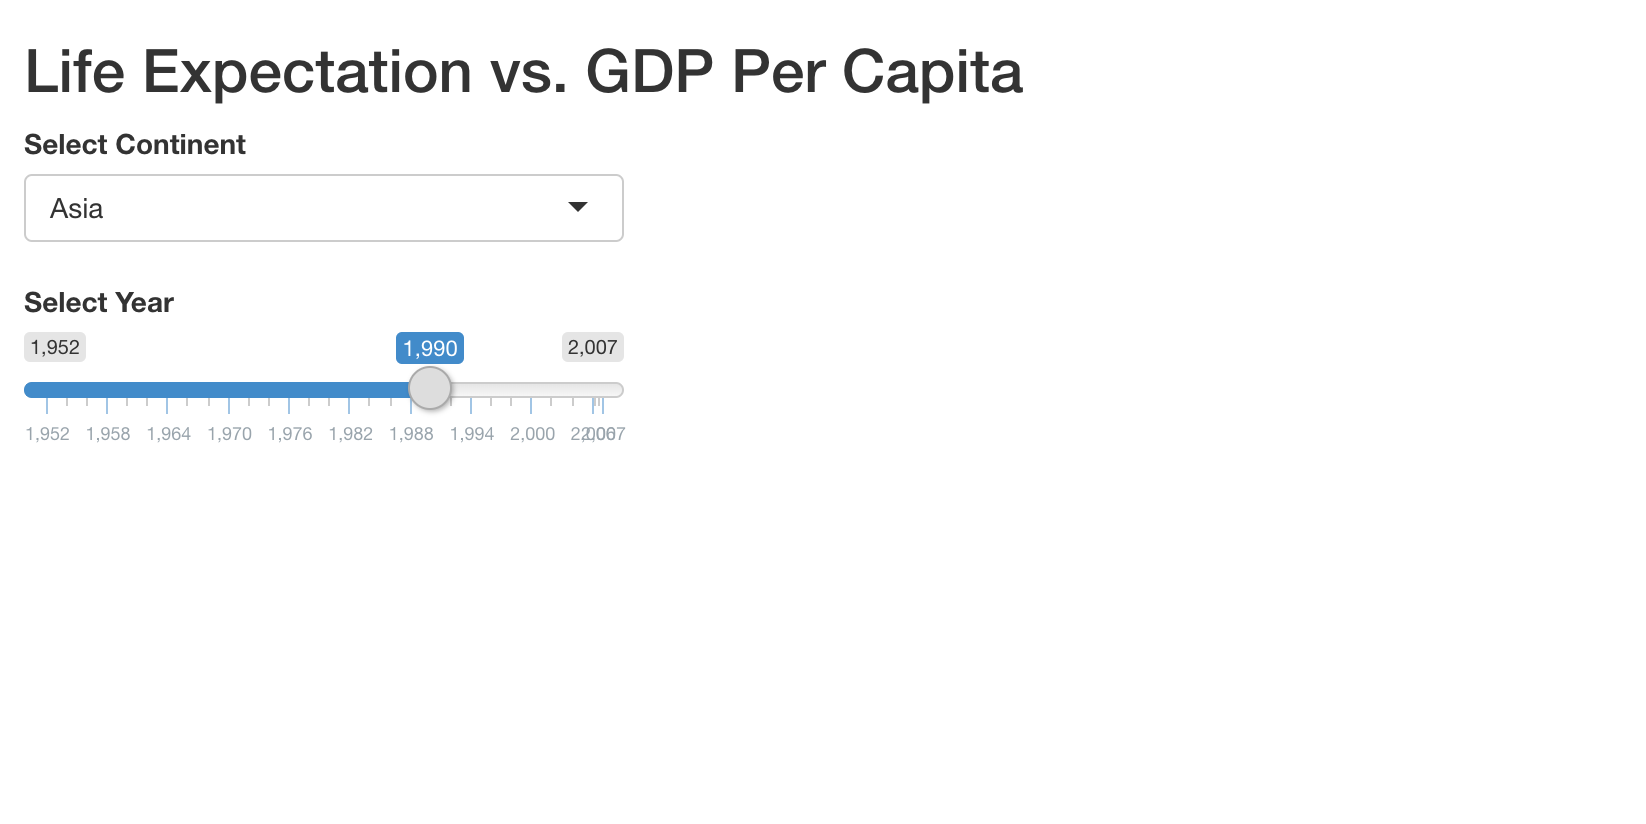
大陸と年を選ぶコントロールを表示するアプリ

Rで作るShiny Webアプリケーション

ステップ2:出力を追加(UI)

ui <- fluidPage(
  titlePanel("Life Expectation vs. GDP Per Capita"),
  selectInput('continent', 'Select Continent', unique(gapminder$continent)),
  sliderInput('year', 'Select Year', 1952, 2007, 1990, step = 5),

plotOutput('plot'), DT::DTOutput('table')
)
Rで作るShiny Webアプリケーション

ステップ2:出力を追加(サーバー)

server <- function(input, output, session){

output$plot <- renderPlot({ ggplot() })
output$table <- DT::renderDT({ gapminder })
}
Rで作るShiny Webアプリケーション

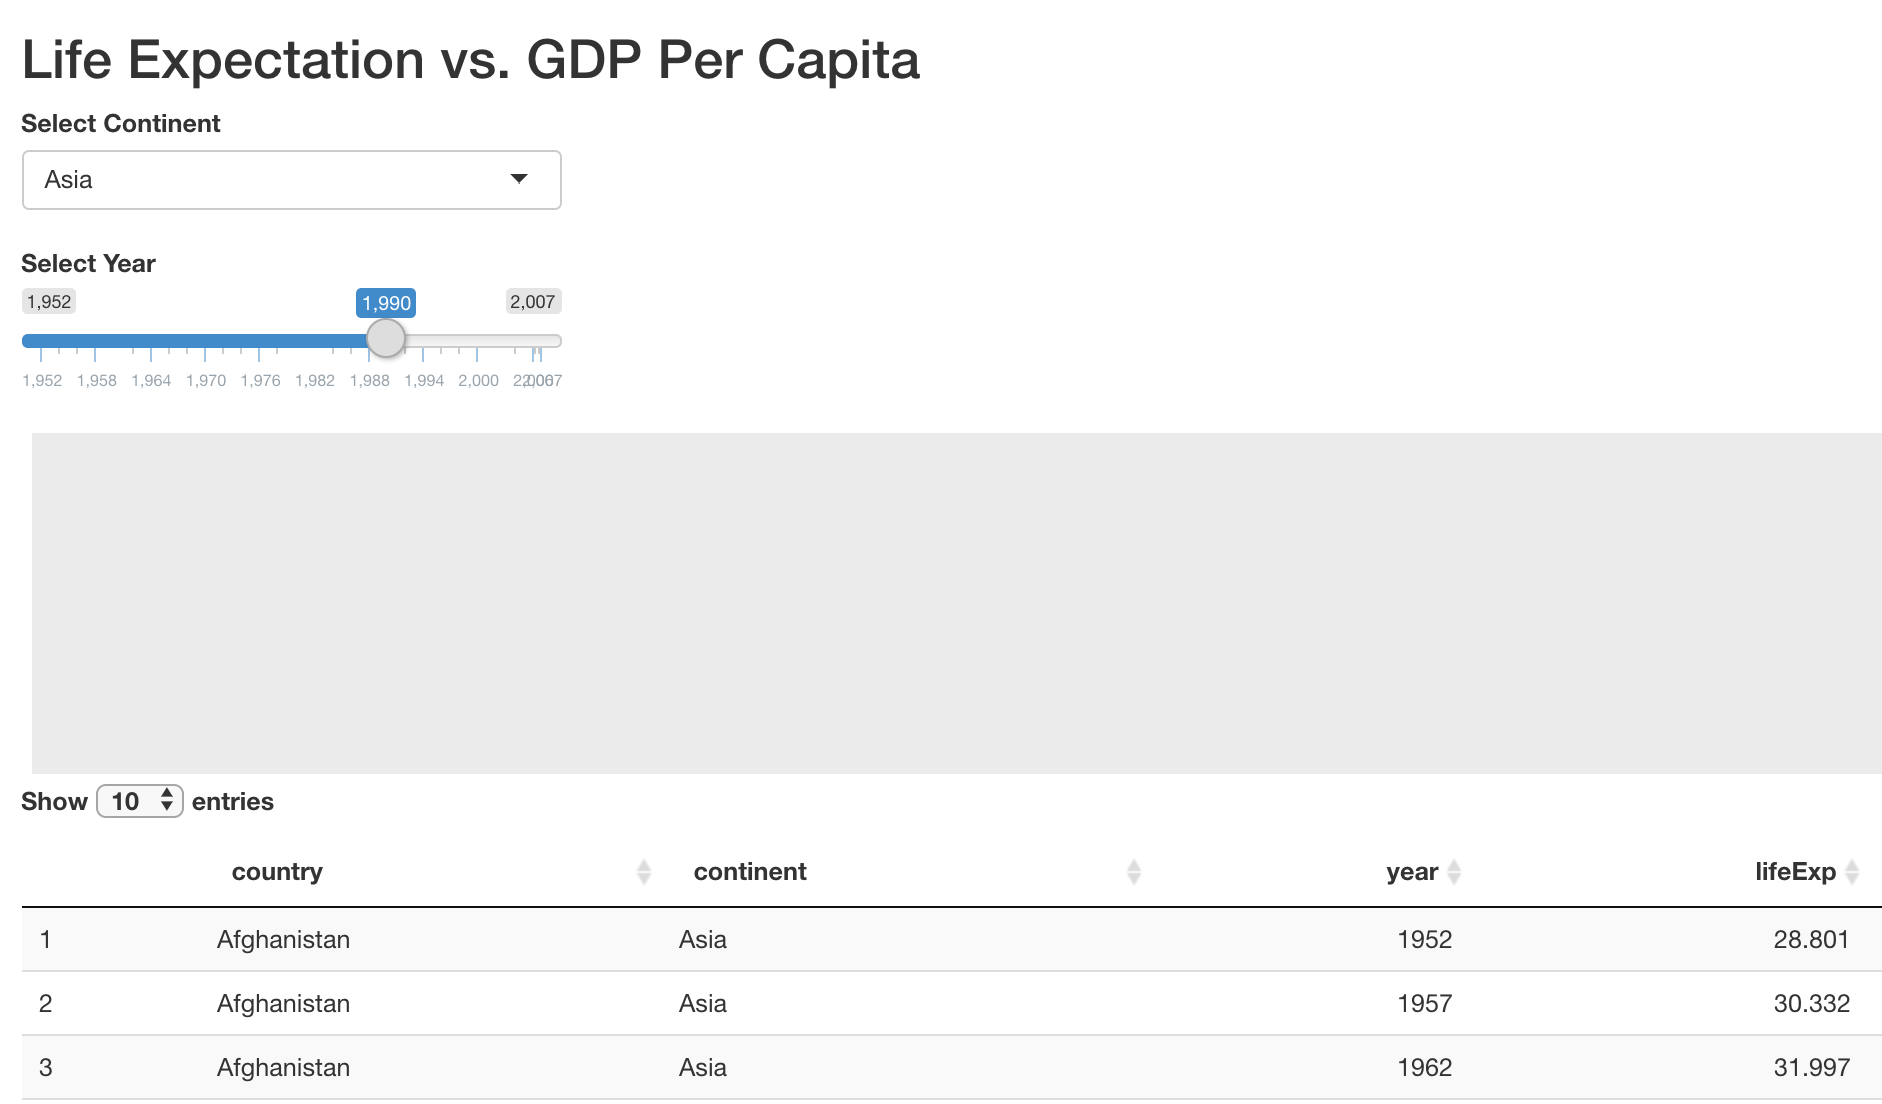
大陸と年を選ぶコントロール、空のプロット、インタラクティブな表を表示するアプリ

Rで作るShiny Webアプリケーション

ステップ3:レイアウトを更新(UI)

ui <- fluidPage(
  titlePanel("Life Expectation vs. GDP Per Capita"),

sidebarLayout(
sidebarPanel( selectInput('continent', 'Select Continent', unique(gapminder$continent)), sliderInput('year', 'Select Year', 1952, 2007, 1990, step = 5) ),
mainPanel( plotOutput('plot'), DT::DTOutput('table') )
) )
Rで作るShiny Webアプリケーション

ステップ3:レイアウトを更新(UI)

ui <- fluidPage(
  titlePanel("Life Expectation vs. GDP Per Capita"),

sidebarLayout(
sidebarPanel( selectInput('continent', 'Select Continent', unique(gapminder$continent)), sliderInput('year', 'Select Year', 1952, 2007, 1990, step = 5) ),
mainPanel( tabsetPanel( tabPanel("Plot", plotOutput('plot')), tabPanel("Table", DT::DTOutput('table')) ) )
) )
Rで作るShiny Webアプリケーション

選択した大陸と年の、平均寿命・人口・一人当たりGDPのインタラクティブな表を表示するアプリ

Rで作るShiny Webアプリケーション

ステップ4:出力を更新(サーバー)

server <- function(input, output, session){
  output$plot <- renderPlot({

data <- gapminder %>% filter(year == input$year) %>% filter(continent == input$continent) print(data) ggplot(data, aes(x = gdpPercap, y = lifeExp)) + geom_point()
}) output$table <- DT::renderDT({
gapminder %>% filter(year == input$year) %>% filter(continent == input$continent) })
}
Rで作るShiny Webアプリケーション

タブ内に、選択した大陸と年の平均寿命 vs. 一人当たりGDPのインタラクティブな散布図を表示するアプリ

Rで作るShiny Webアプリケーション

練習しましょう!

Rで作るShiny Webアプリケーション

Preparing Video For Download...