サブグラフ

Pythonで学ぶネットワーク分析入門

Eric Ma

Data Carpentry instructor and author of nxviz package

サブグラフ

  • 大規模グラフの一部を可視化
    • パス
    • コミュニティ/クリーク
    • ノードからの分離度
Pythonで学ぶネットワーク分析入門

サブグラフ

import networkx as nx
G = nx.erdos_renyi_graph(n=20, p=0.2)

G.nodes()
NodeView([0, 1, 2, 3, 4, 5, 6, 7, 8, 9, 10, 11, 12, 13, 14, 15, 16, 17,
18, 19])
nodes = list(G.neighbors(8))
nodes
[2, 3, 4, 10]
nodes.append(8)
Pythonで学ぶネットワーク分析入門

サブグラフ

G_eight = G.subgraph(nodes)

G_eight.edges()
EdgeView([(8, 2), (8, 3), (8, 4), (8, 10), (2, 10)])
G_eight
<networkx.classes.graph.Graph at 0x10cae39e8>
G
<networkx.classes.graph.Graph at 0x10cad1f60>
Pythonで学ぶネットワーク分析入門

サブグラフ

nx.draw(G_eight, with_labels=True)
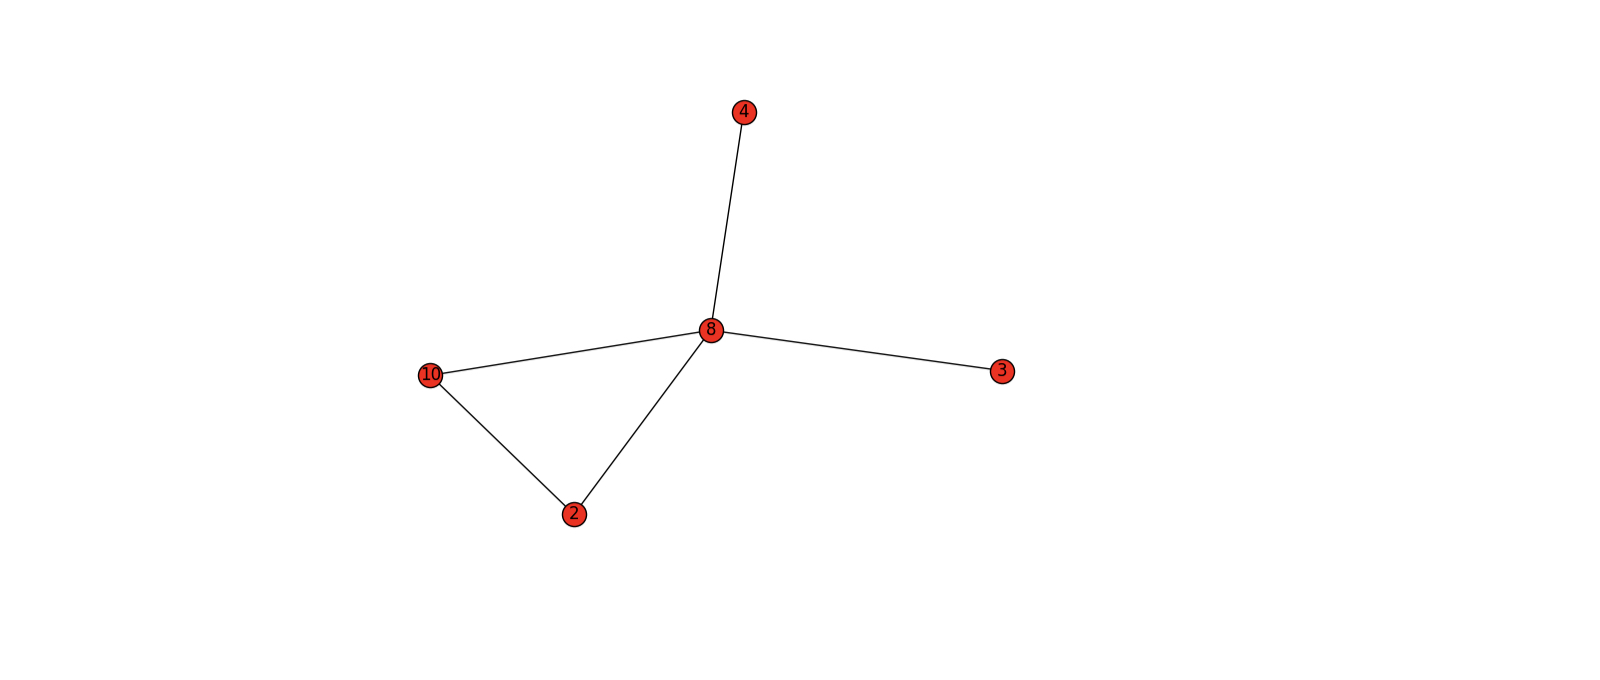
5つのノードを持つグラフ。サイズ3のクリークを含む。

Pythonで学ぶネットワーク分析入門

練習しましょう!

Pythonで学ぶネットワーク分析入門

Preparing Video For Download...