Seabornの回帰プロット
Seaborn による中級データ可視化

Chris Moffitt
Instructor
regplotの概要
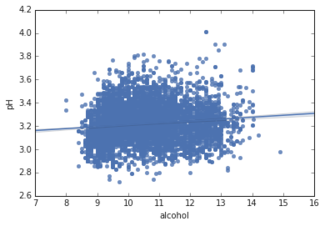
regplot関数は回帰直線付きの散布図を生成する- 使い方は
displotと同様 data、x、y変数の指定が必要
sns.regplot(data=df, x="alcohol", y="pH" )
lmplot()はregplot()をベースに構築されている
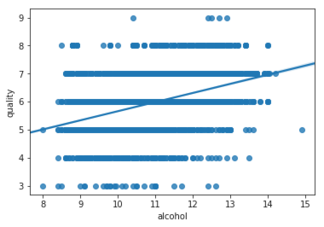
regplot- 低レベル
sns.regplot(data=df,
            x="alcohol",
            y="quality")
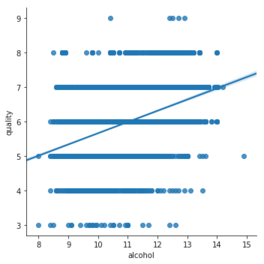
lmplot- 高レベル
sns.lmplot(data=df,
           x="alcohol",
           y="quality")
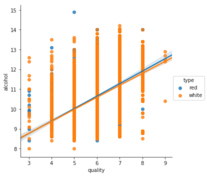
lmplotのファセット
- 色でデータを整理する(
hue)
sns.lmplot(data=df,
           x="quality",
           y="alcohol",
           hue="type")
- 列でデータを整理する(
col)
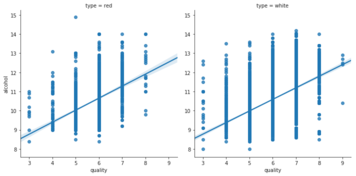
sns.lmplot(data=df,
           x="quality",
           y="alcohol",
           col="type")