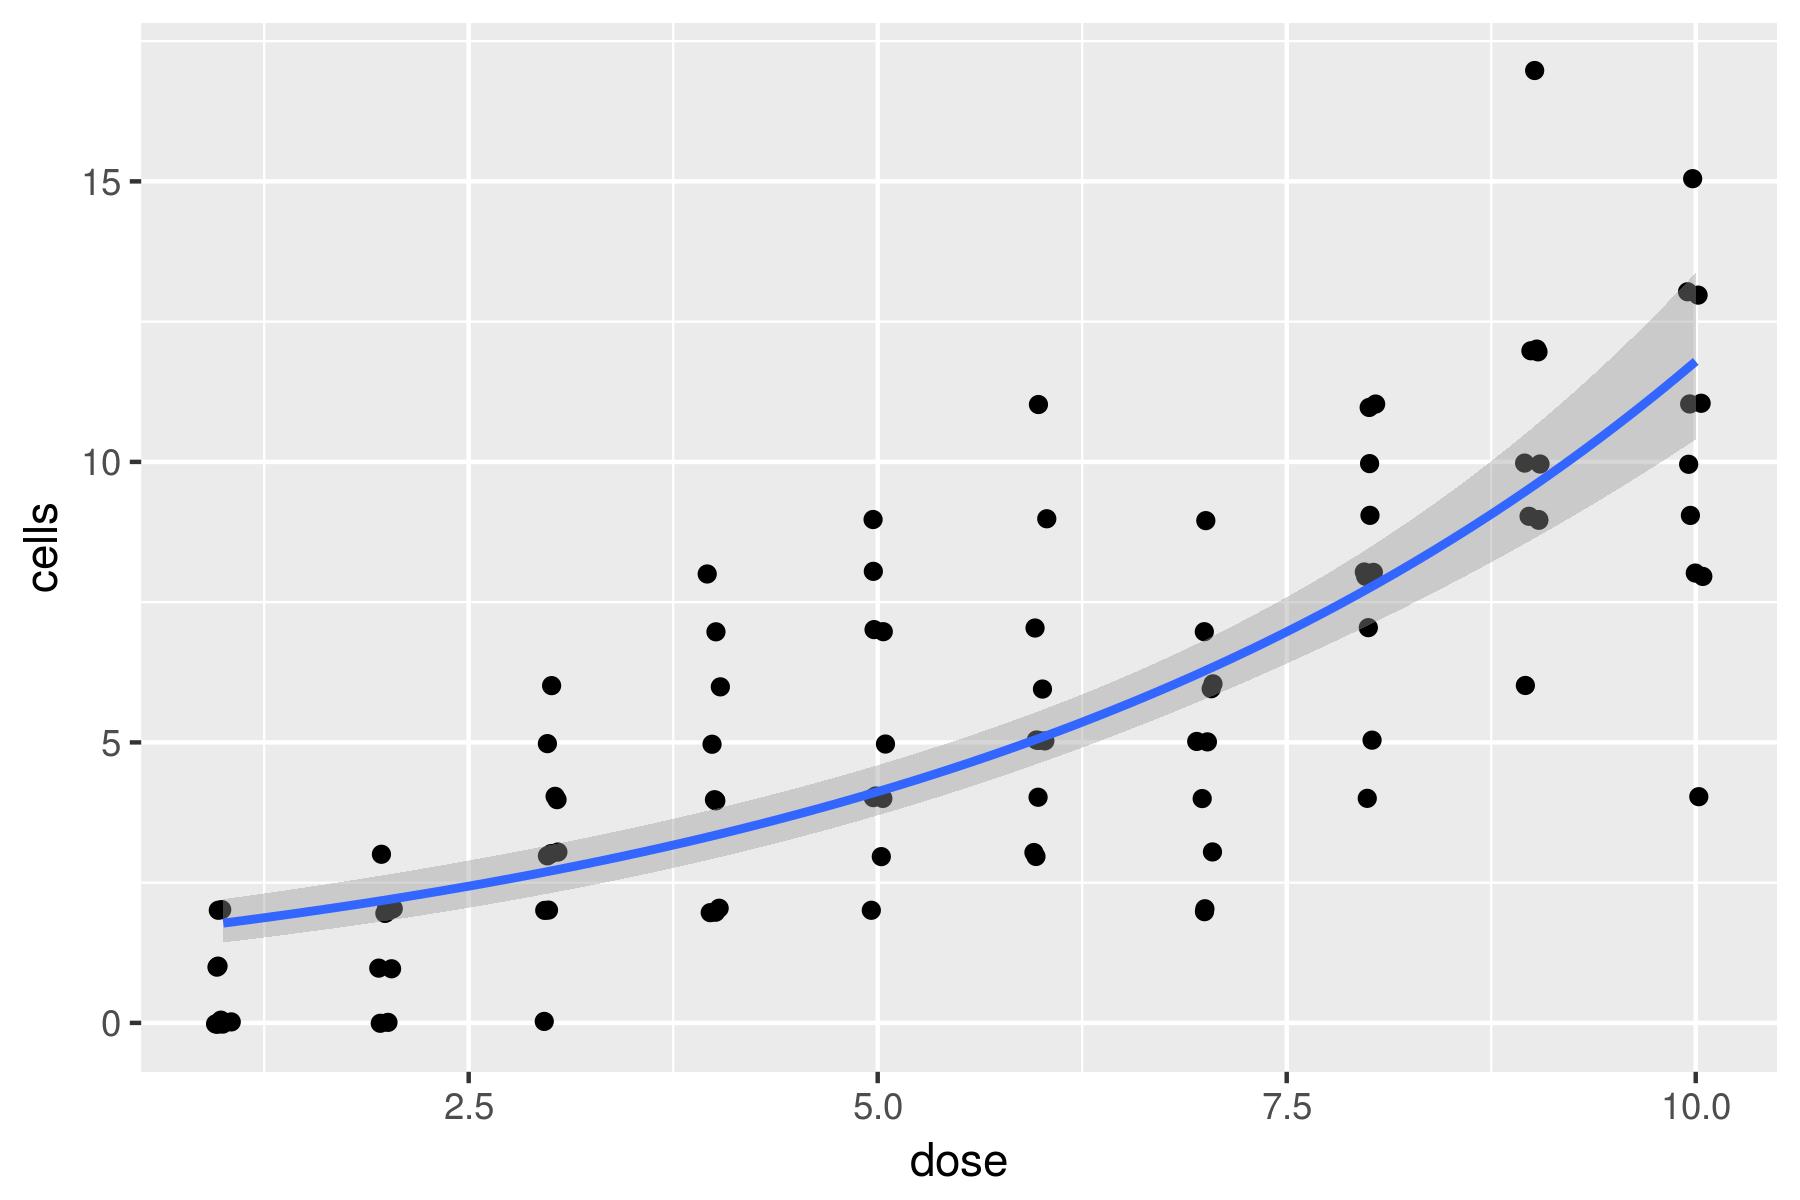
ポアソン回帰のプロット
R における Generalized Linear Models

Richard Erickson
Instructor
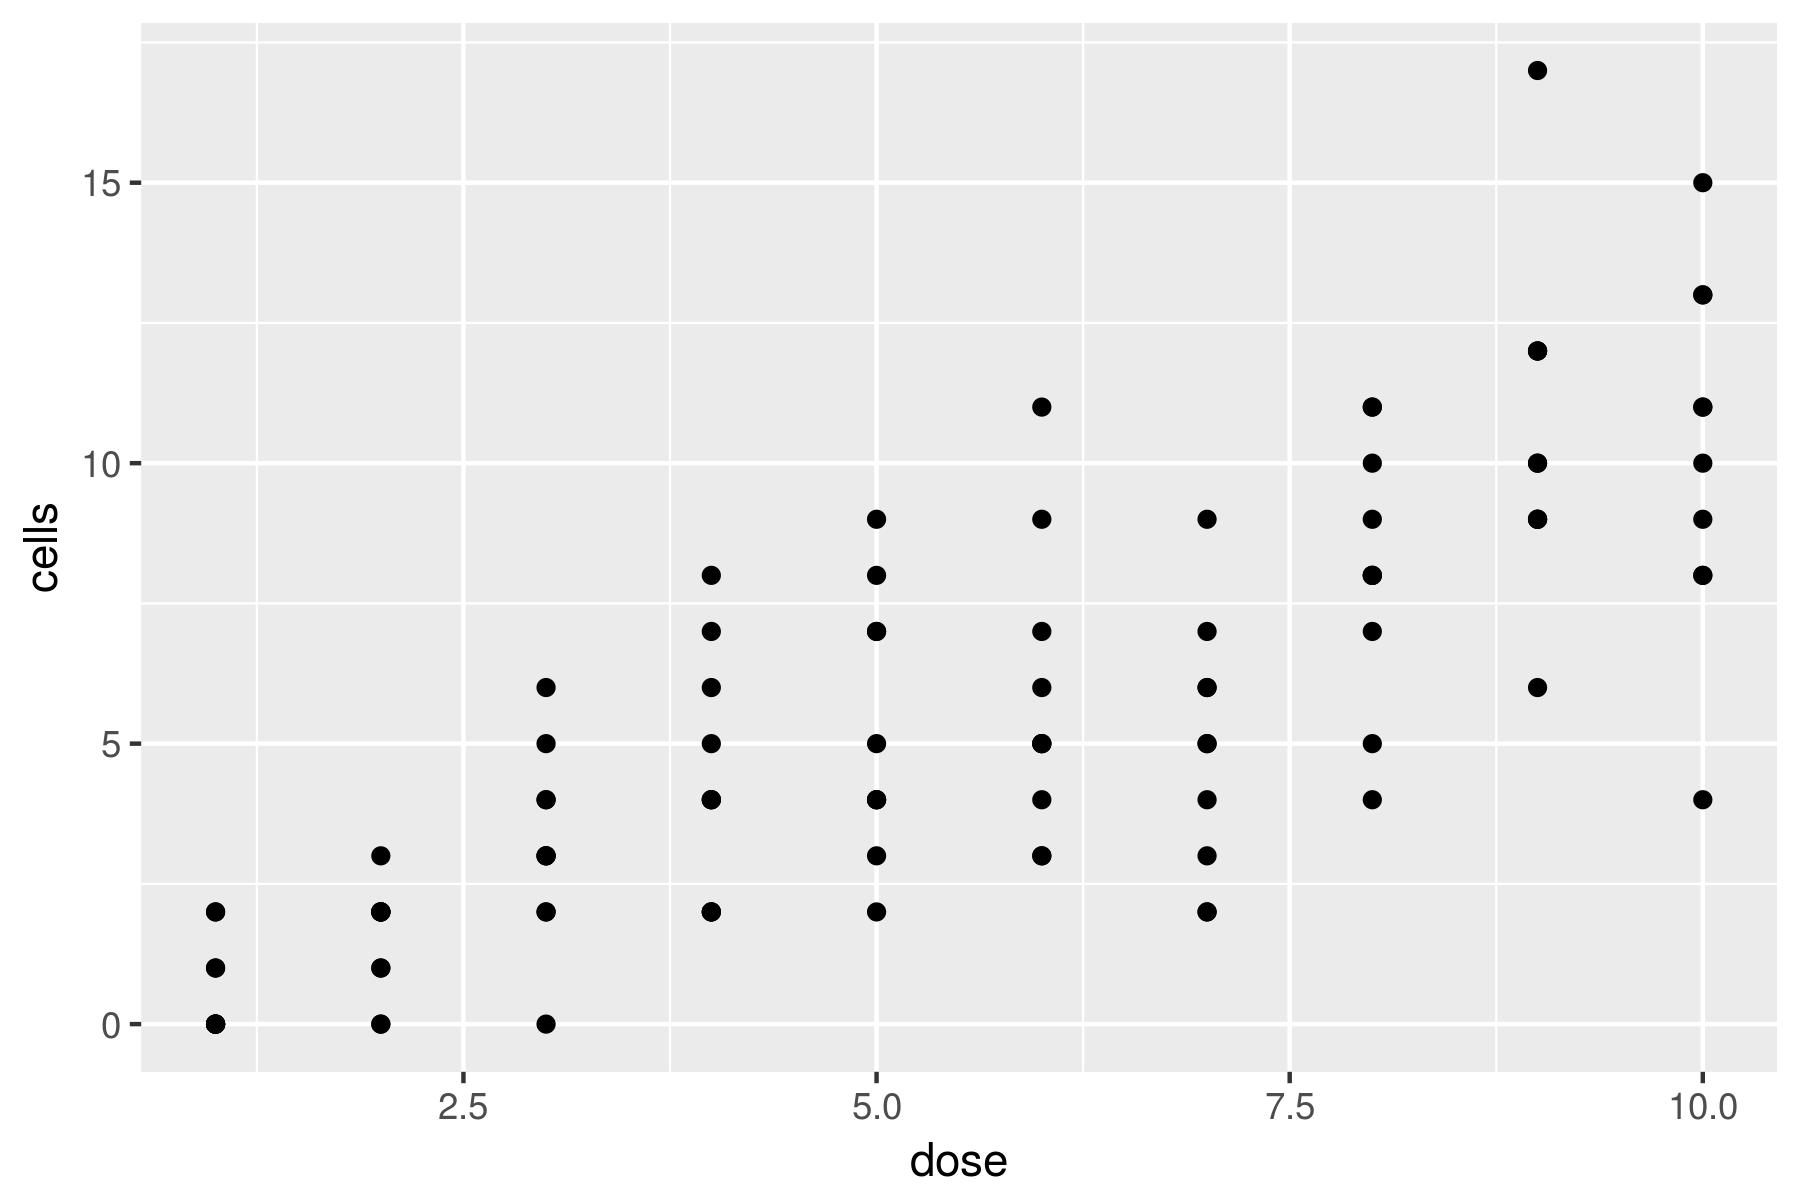
点を描く
ggplot(data = dat, aes(x = dose, y = cells)) +
    geom_point()
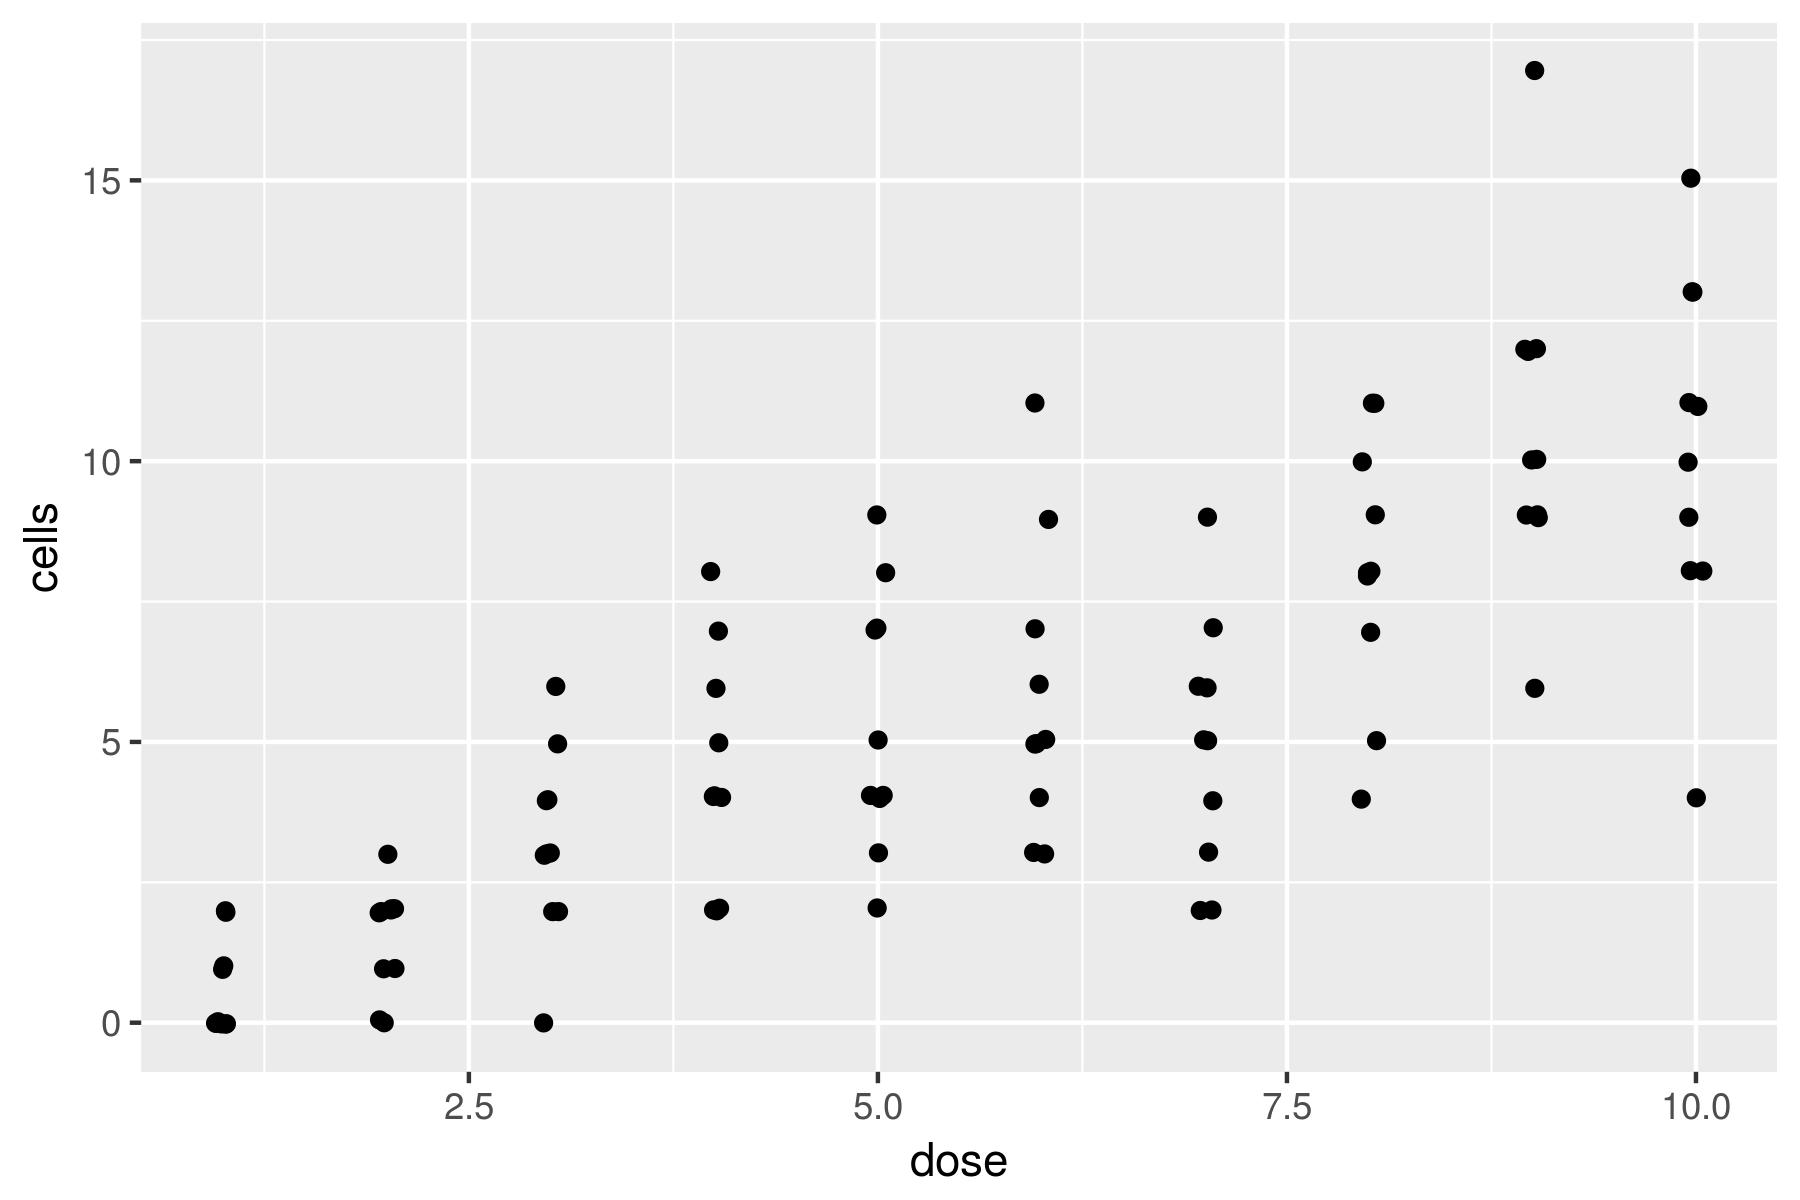
ジッターを付ける
ggplot(data = dat, aes(x = dose, y = cells)) +
   geom_jitter(width = 0.05, height = 0.05)
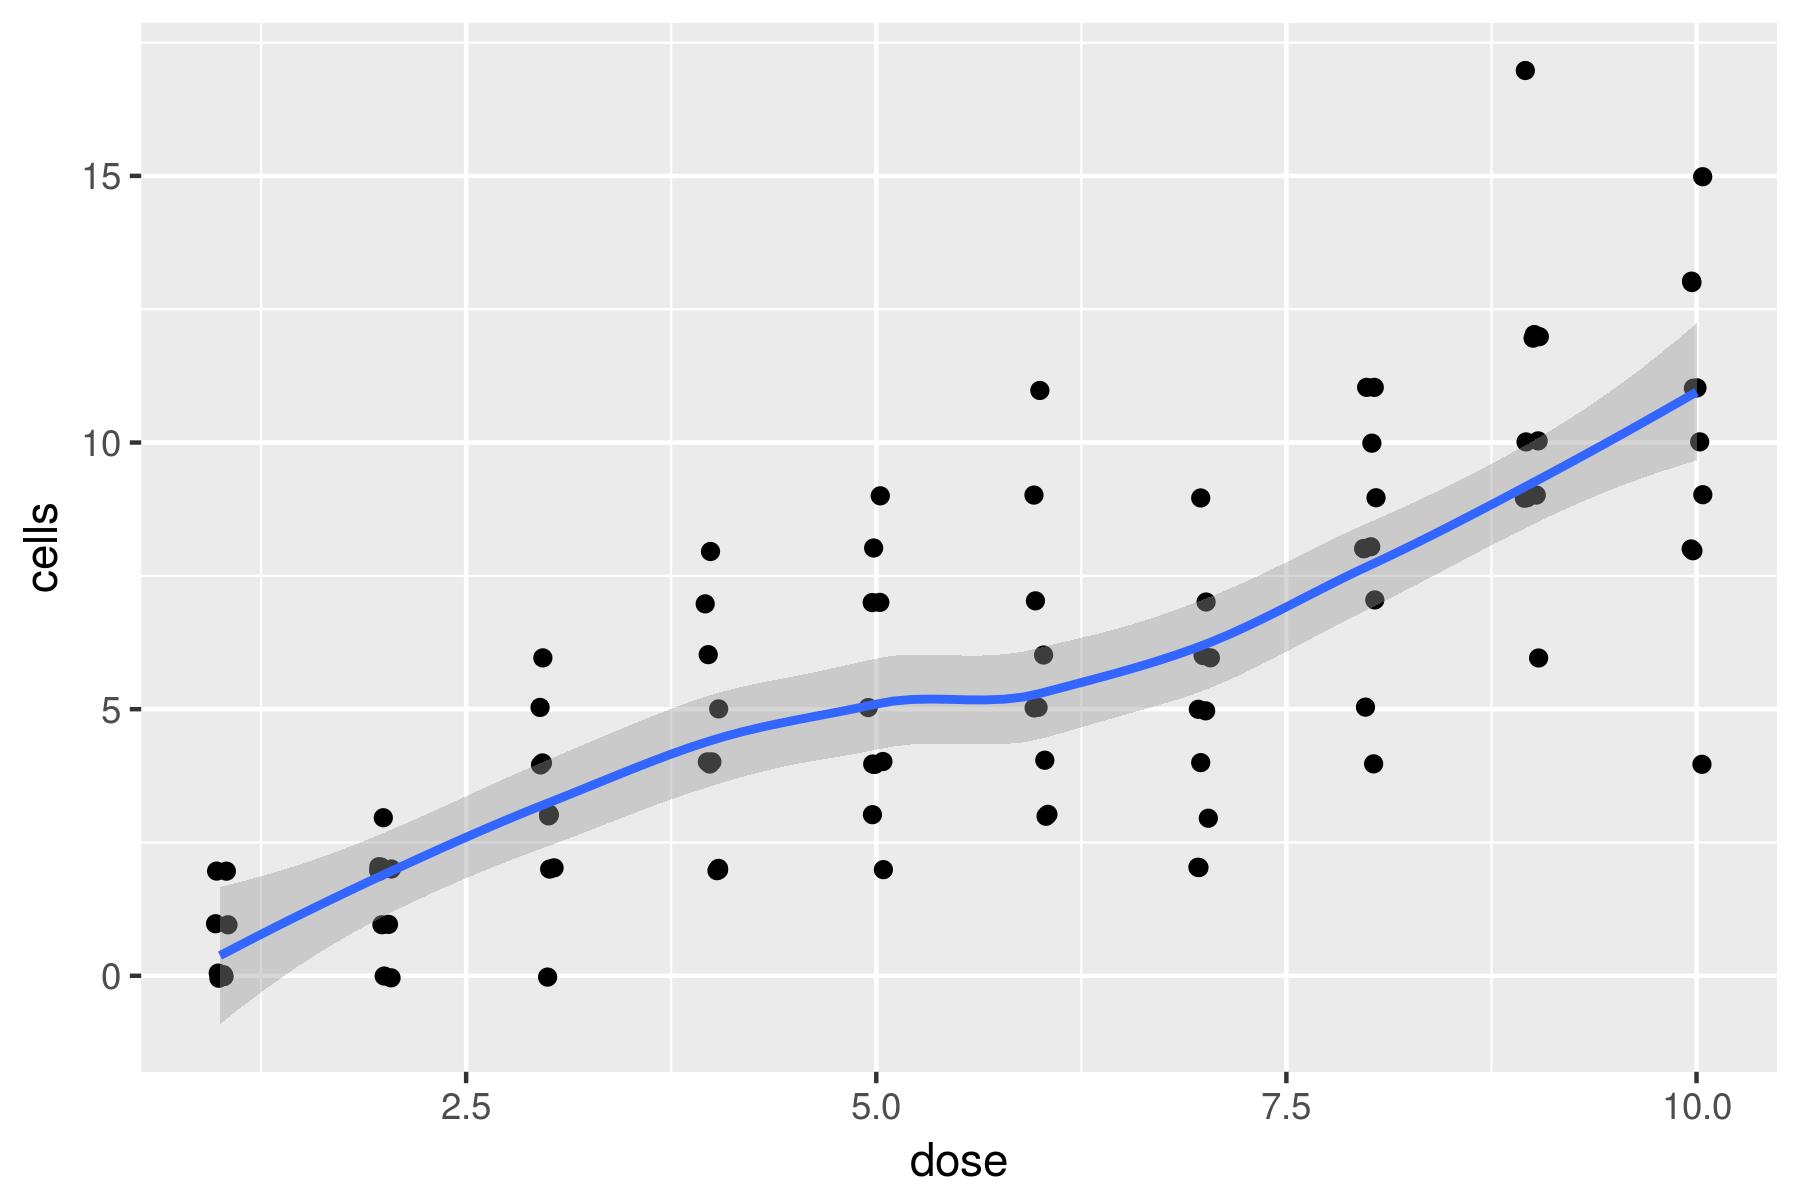
geom_smooth()
ggplot(data = dat, aes(x = dose, y = cells)) +
   geom_jitter(width = 0.05, height = 0.05)
   geom_smooth()
geom_smooth() での GLM
ggplot(data = dat, aes(x = dose, y = cells)) +
   geom_jitter(width = 0.05, height = 0.05)
   geom_smooth(method = 'glm')
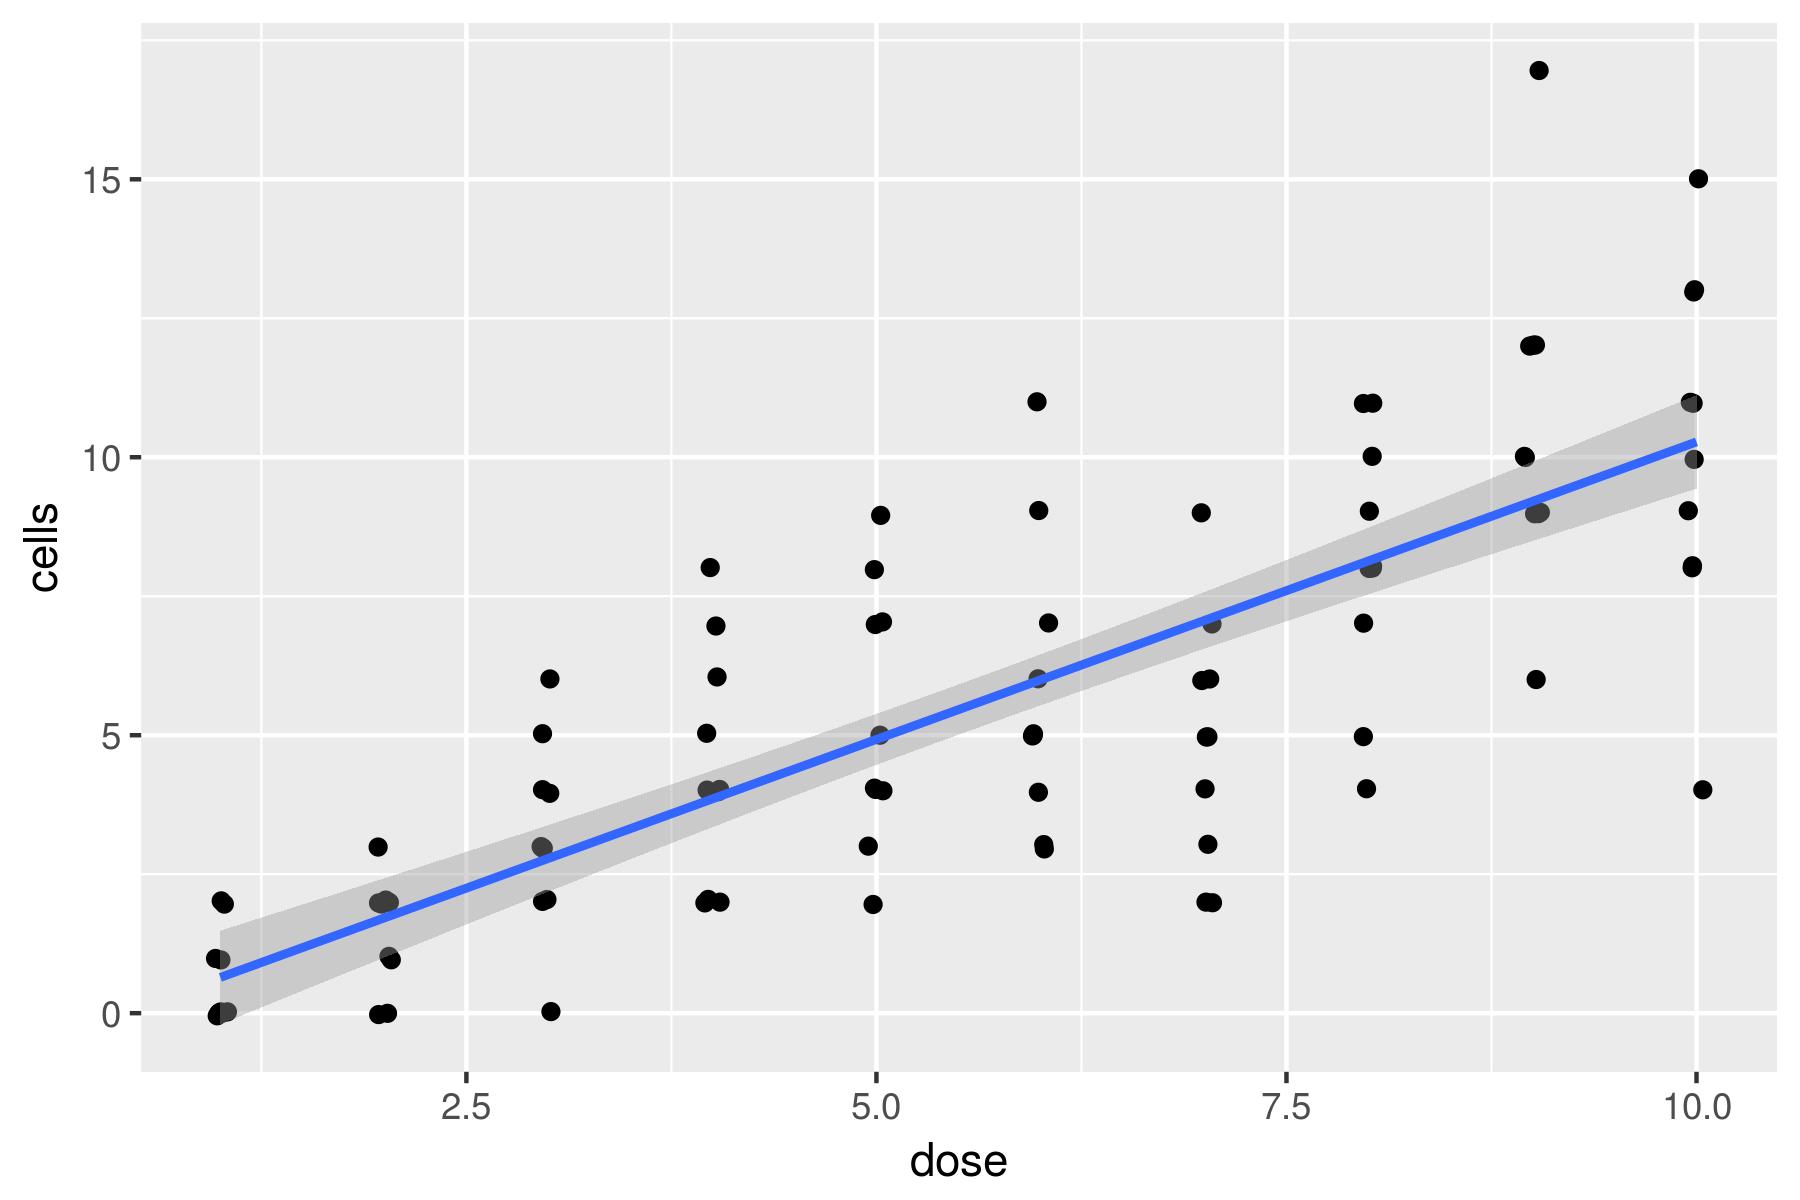
geom_smooth() によるポアソンGLM
ggplot(data = dat, aes(x = dose, y = cells)) +
   geom_jitter(width = 0.05, height = 0.05) +
   geom_smooth(method = 'glm', method.args = list(family = 'poisson'))