外れ値検出のための時系列分解

Anomaly Detection in Python

Bekhruz (Bex) Tuychiev

Kaggle Master, Data Science Content Creator

季節性
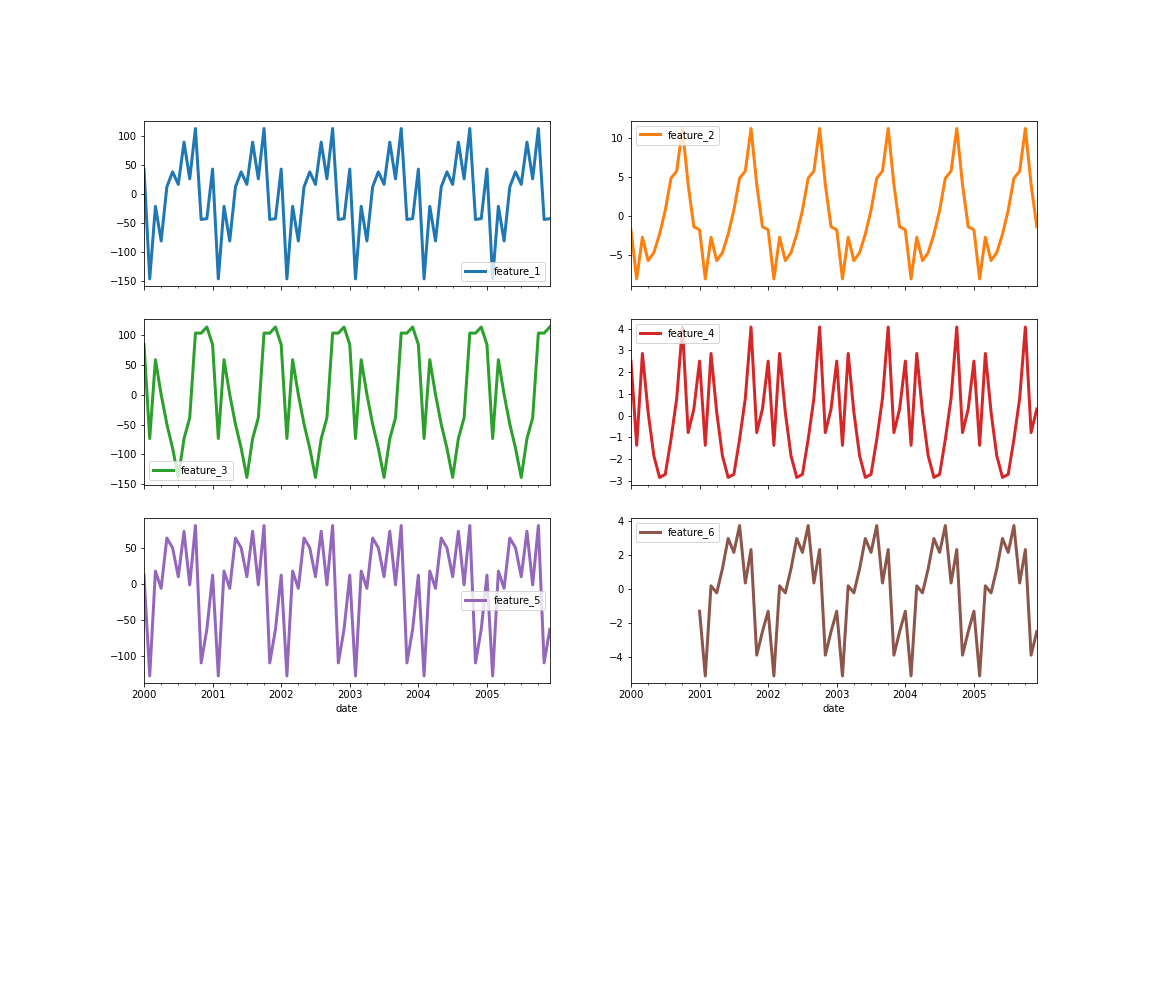
  • 時系列の繰り返しパターン
  • 一定の周期:
    • 毎時
    • 毎日
    • 毎週
    • 毎月 など
  • 例:
    • 日平均気温
    • アイスクリームの売上
Anomaly Detection in Python

季節性

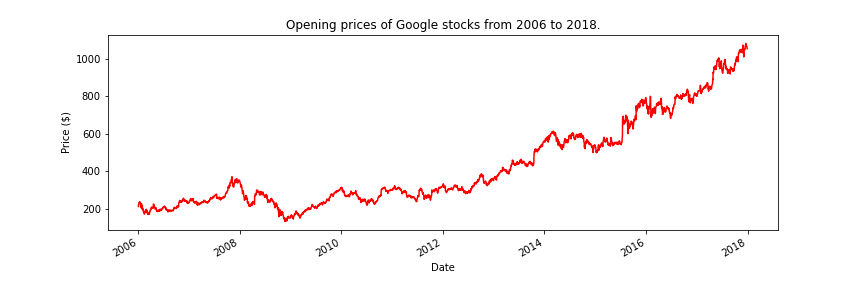
Google株の始値の折れ線グラフ

Anomaly Detection in Python

seasonal_decompose

from statsmodels.tsa.seasonal import seasonal_decompose

results = seasonal_decompose(google['Open'], period=365)

print(results)
<statsmodels.tsa.seasonal.DecomposeResult object at 0x7f0a67fac820>
Anomaly Detection in Python

季節性のプロット

results.seasonal.plot(color="red", figsize=(12, 4))
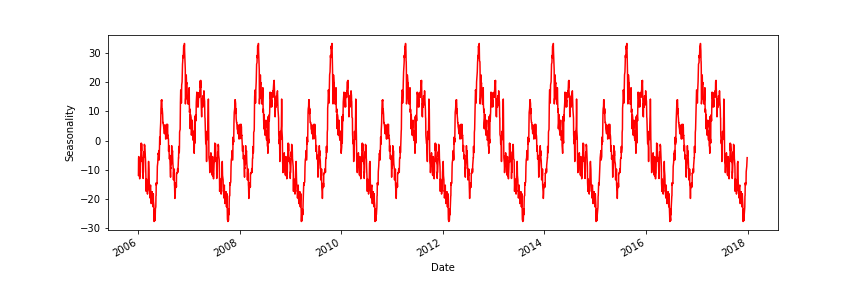
Google株の始値の季節性プロット

Anomaly Detection in Python

季節性の例

時系列の季節性の例

Anomaly Detection in Python

株価の初期プロット

Google株の始値の初期プロット

Anomaly Detection in Python

トレンド

results.trend.plot(color="red", figsize=(12, 4))

Anomaly Detection in Python

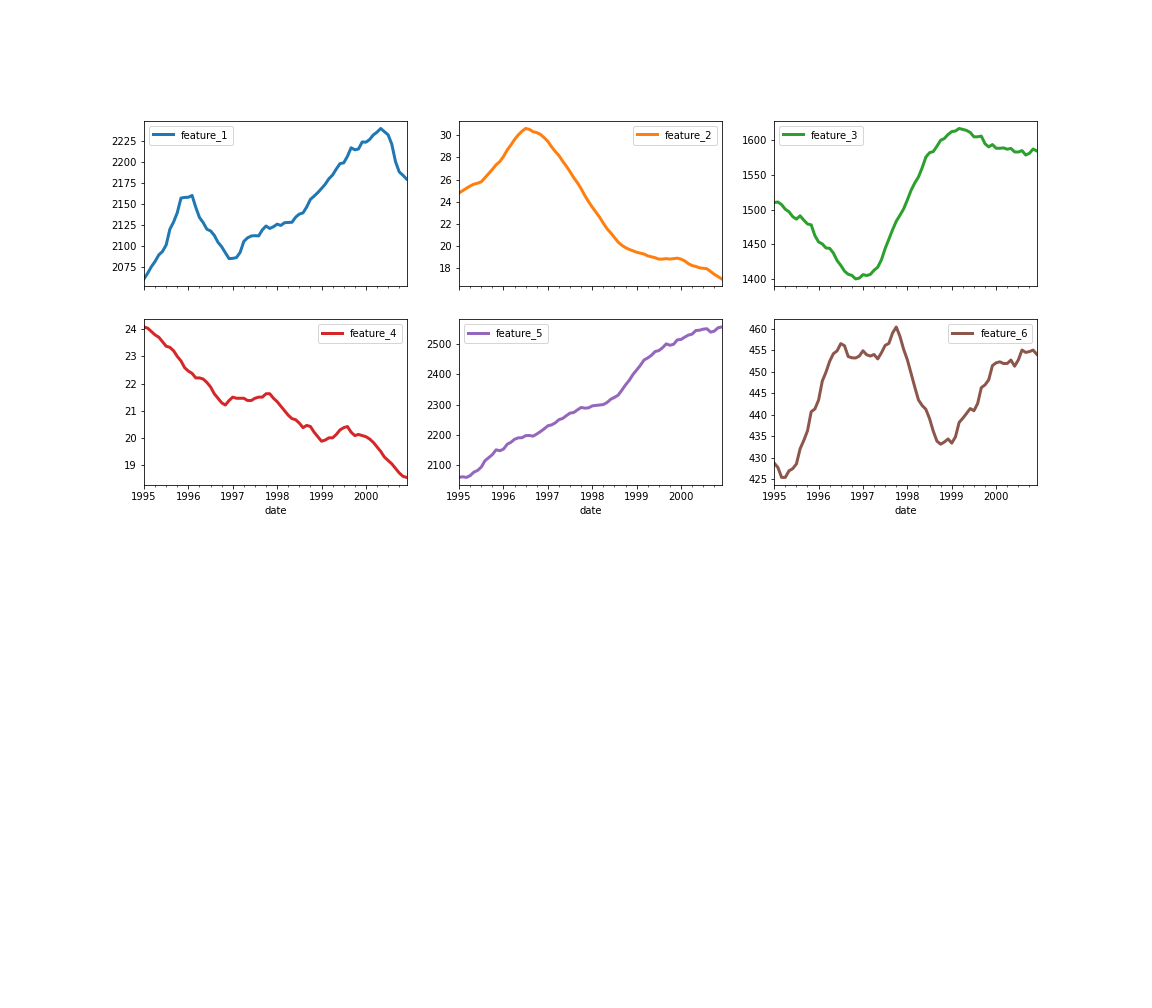
トレンドの例

時系列トレンドの例

Anomaly Detection in Python

残差

results.resid.plot(color="red", figsize=(12, 4))
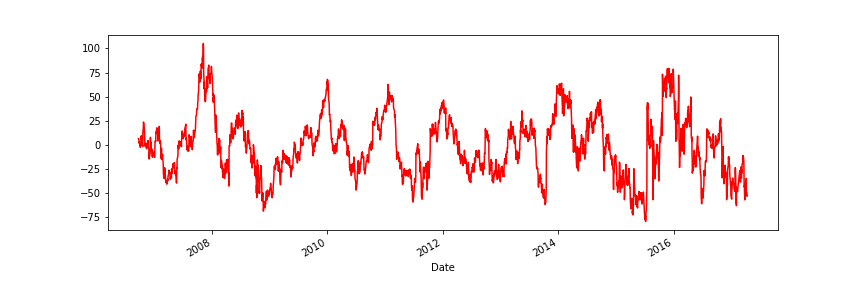
Google株の始値の残差プロット

Anomaly Detection in Python

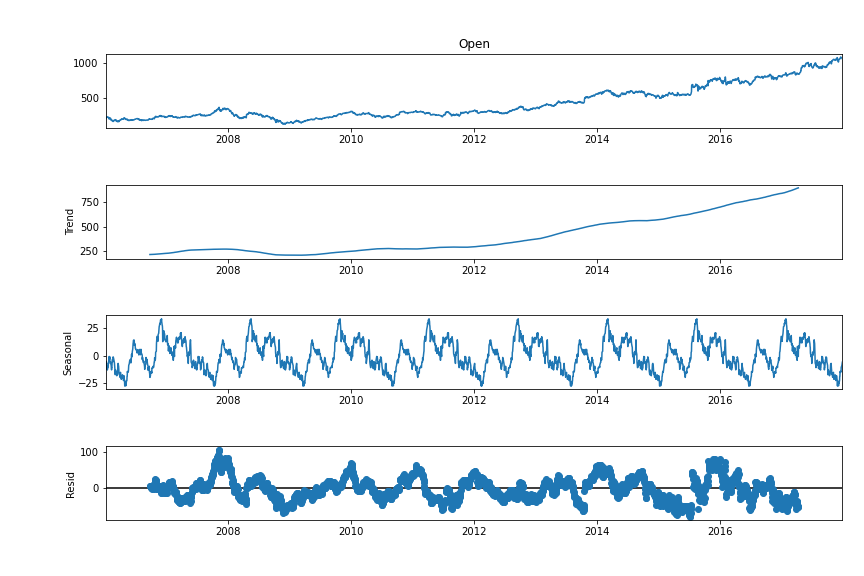
分解

figure = results.plot()

figure.set_figwidth(12)
figure.set_figheight(8)

時系列の3要素を可視化

Anomaly Detection in Python

分類器の学習

# 残差の抽出と整形
results = seasonal_decompose(google['Volume'], period=365)
residuals = results.resid
residuals = residuals.values.reshape(-1, 1)


# MAD を学習 mad = MAD().fit(residuals)
# 外れ値の検出 is_outlier = mad.labels_ == 1 outliers = google[is_outlier] print(len(outliers))
81
Anomaly Detection in Python

Vamos praticar!

Anomaly Detection in Python

Preparing Video For Download...