箱ひげ図とIQR

Anomaly Detection in Python

Bekhruz (Bex) Tuychiev

Kaggle Master, Data Science Content Creator

箱ひげ図の復習
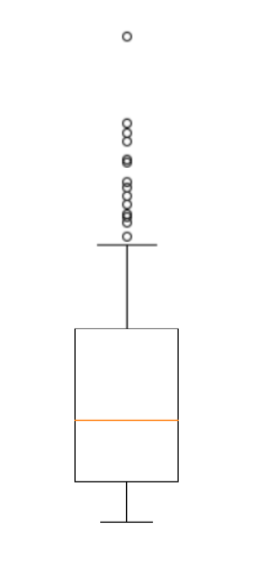
  • 箱ひげ図は:
    • 5数要約の強化版の可視化
    • データの位置、散らばり、歪度を示す
    • 外れ値の有無を示す

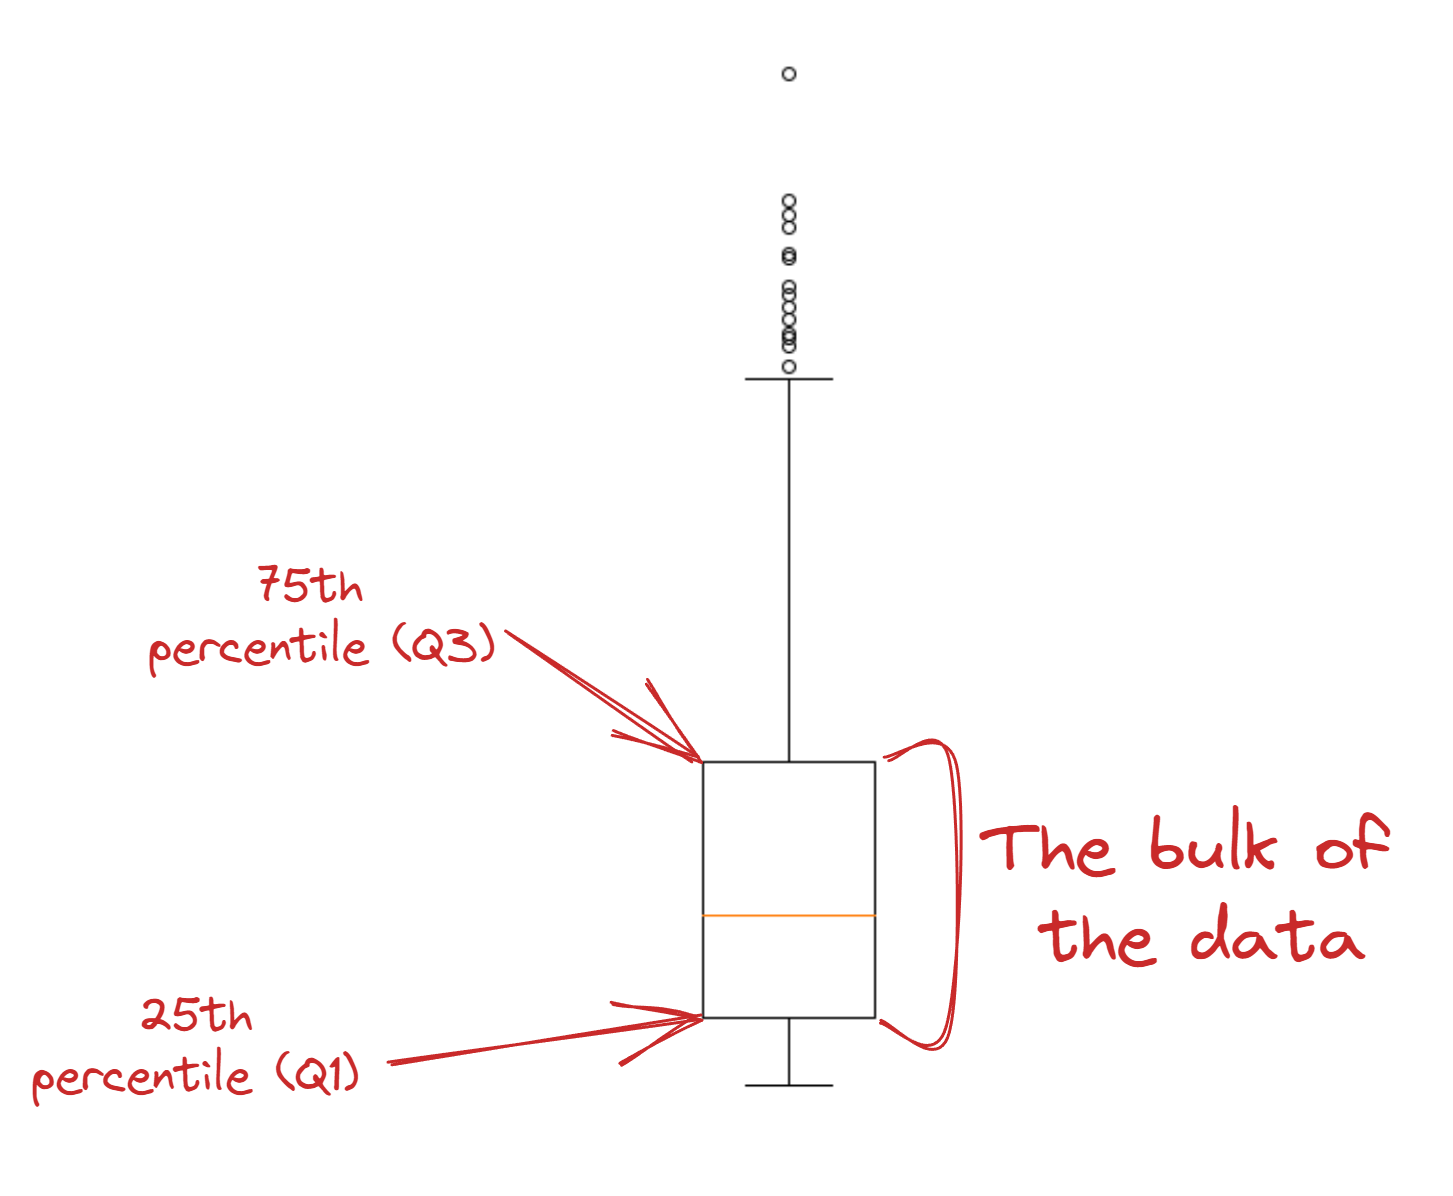
注釈付きのサンプル箱ひげ図。

Anomaly Detection in Python

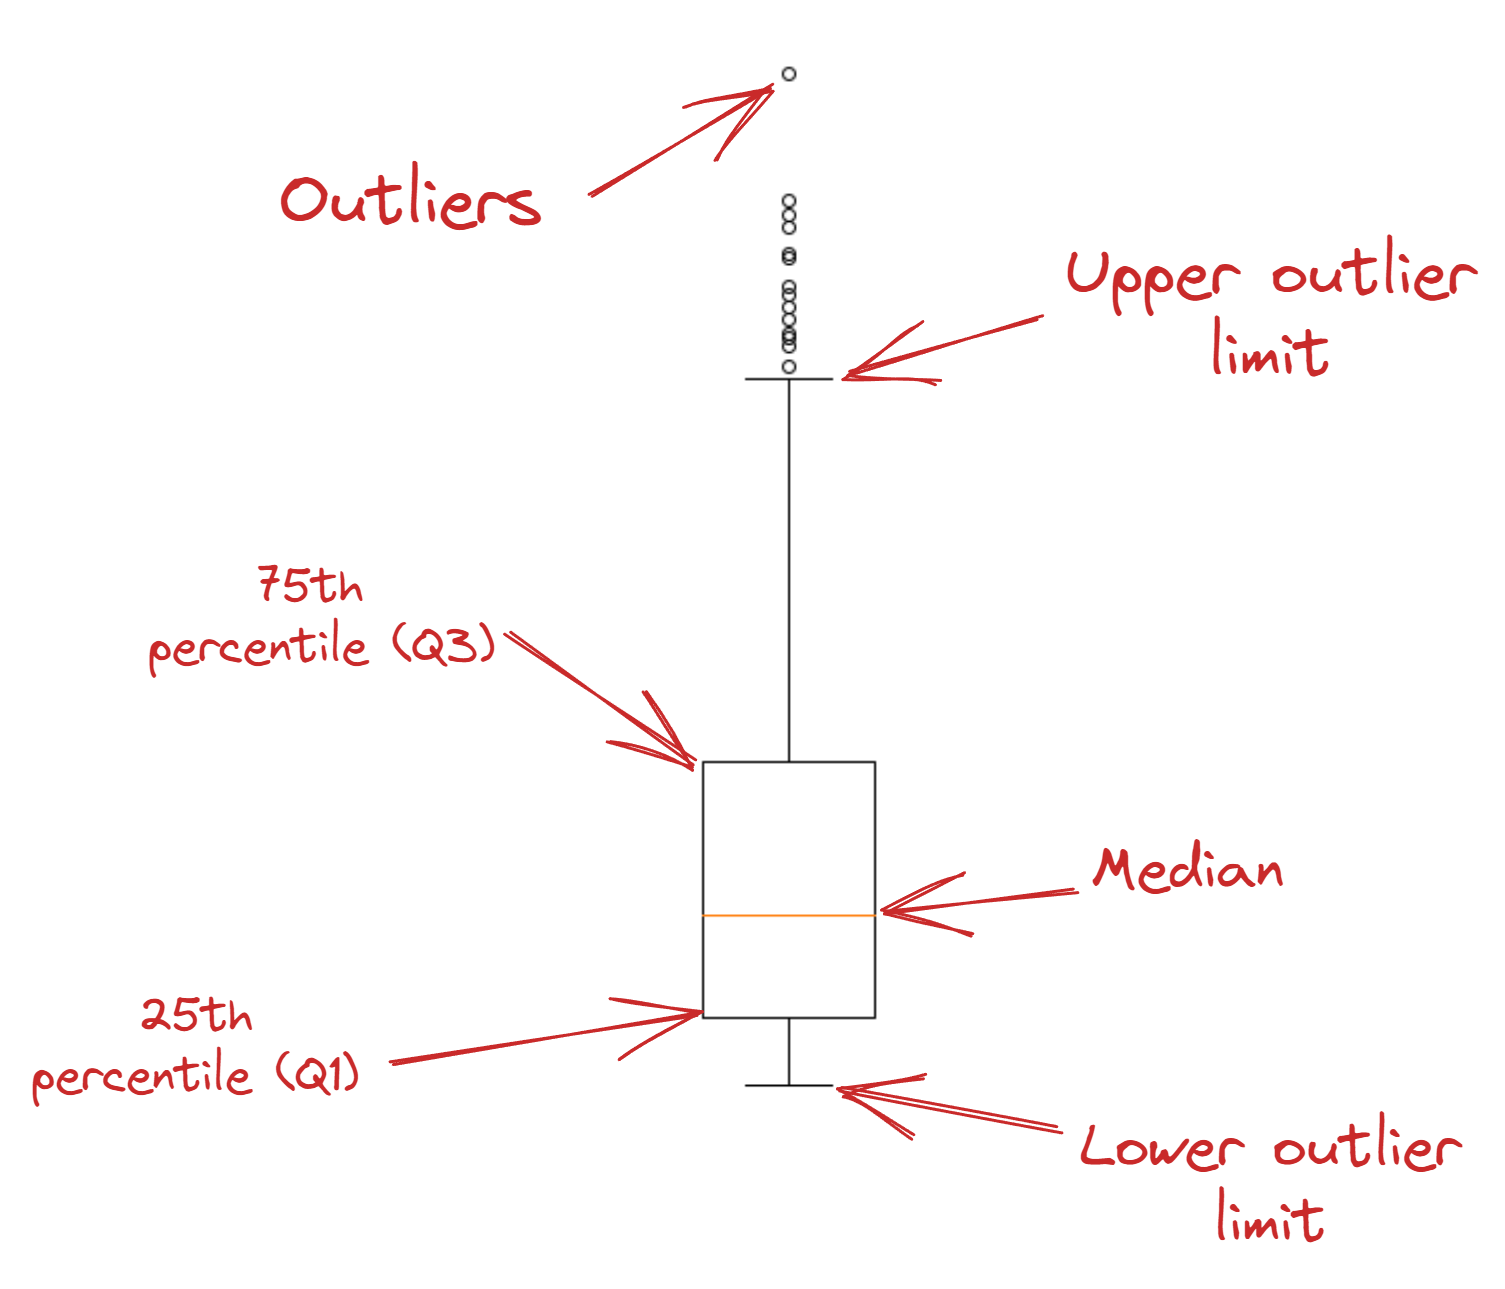
箱ひげ図の構成要素

第1四分位点、 第3四分位点、箱に矢印とテキストで注釈を付けた箱ひげ図。

Anomaly Detection in Python

ひげ

中央値、外れ値例、上下の外れ値限界に注釈を付けた別の箱ひげ図。

Anomaly Detection in Python

四分位範囲(IQR)

  • IQR:四分位範囲
  • IQR = Q3 - Q1
  • ひげの長さ=IQRと係数の組合せ

前スライドと同じ箱ひげ図(小さめ)。

Anomaly Detection in Python

ひげの長さの計算

  • 係数 = 1.5
  • 下限: $Q1 - 1.5 * IQR$
  • 上限: $Q3 + 1.5 * IQR$

前スライドと同じ箱ひげ図。

Anomaly Detection in Python

箱ひげ図の描画

import matplotlib.pyplot as plt

plt.boxplot(sales)
plt.xlabel("Product sales")

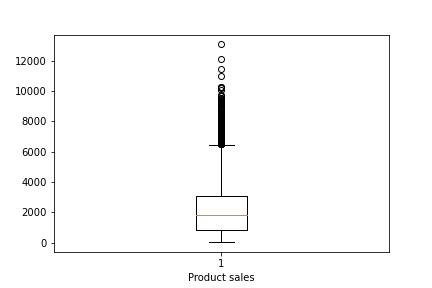
多数の外れ値が上限を越えて黒い線のように並ぶ、製品売上の箱ひげ図。

Anomaly Detection in Python

ひげの長さを制御

plt.boxplot(sales, whis=2.5)
plt.xlabel("Product sales")

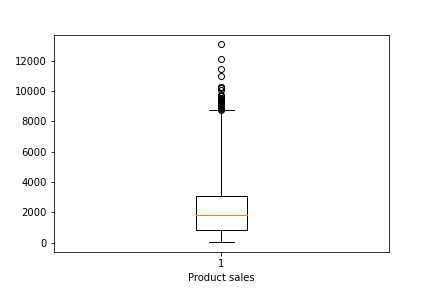
上ひげの上にある外れ値が少ない、製品売上の箱ひげ図。

Anomaly Detection in Python

コードでの IQR

# パーセンタイルを計算
q1 = sales.quantile(0.25)
q3 = sales.quantile(0.75)


# IQR を計算 IQR = q3 - q1 # 乗数係数を設定 factor = 2.5
Anomaly Detection in Python

IQRで外れ値を検出

# 上下限を計算
lower_limit = q1 - (IQR * factor)


upper_limit = q3 + (IQR * factor)
# マスクを作成
is_lower = sales < lower_limit
is_upper = sales > upper_limit


# 抽出 outliers = sales[is_lower | is_upper] # 外れ値の数を表示 print(len(outliers))
29
Anomaly Detection in Python

手法の柔軟性

  • 箱ひげ図とIQRフィルタは柔軟性が高い
  • 外れ値の判定ルールをカスタム可能
Anomaly Detection in Python

Ayo berlatih!

Anomaly Detection in Python

Preparing Video For Download...