外れ値に強い特徴量スケーリング

Anomaly Detection in Python

Bekhruz (Bex) Tuychiev

Kaggle Master, Data Science Content Creator

ユークリッド距離
A = np.array([9, 1, 6])
B = np.array([25, 44, 85])


diffs = (B - A) ** 2
dist_AB = np.sqrt(np.sum(diffs)) print(dist_AB)
91.35644476444998

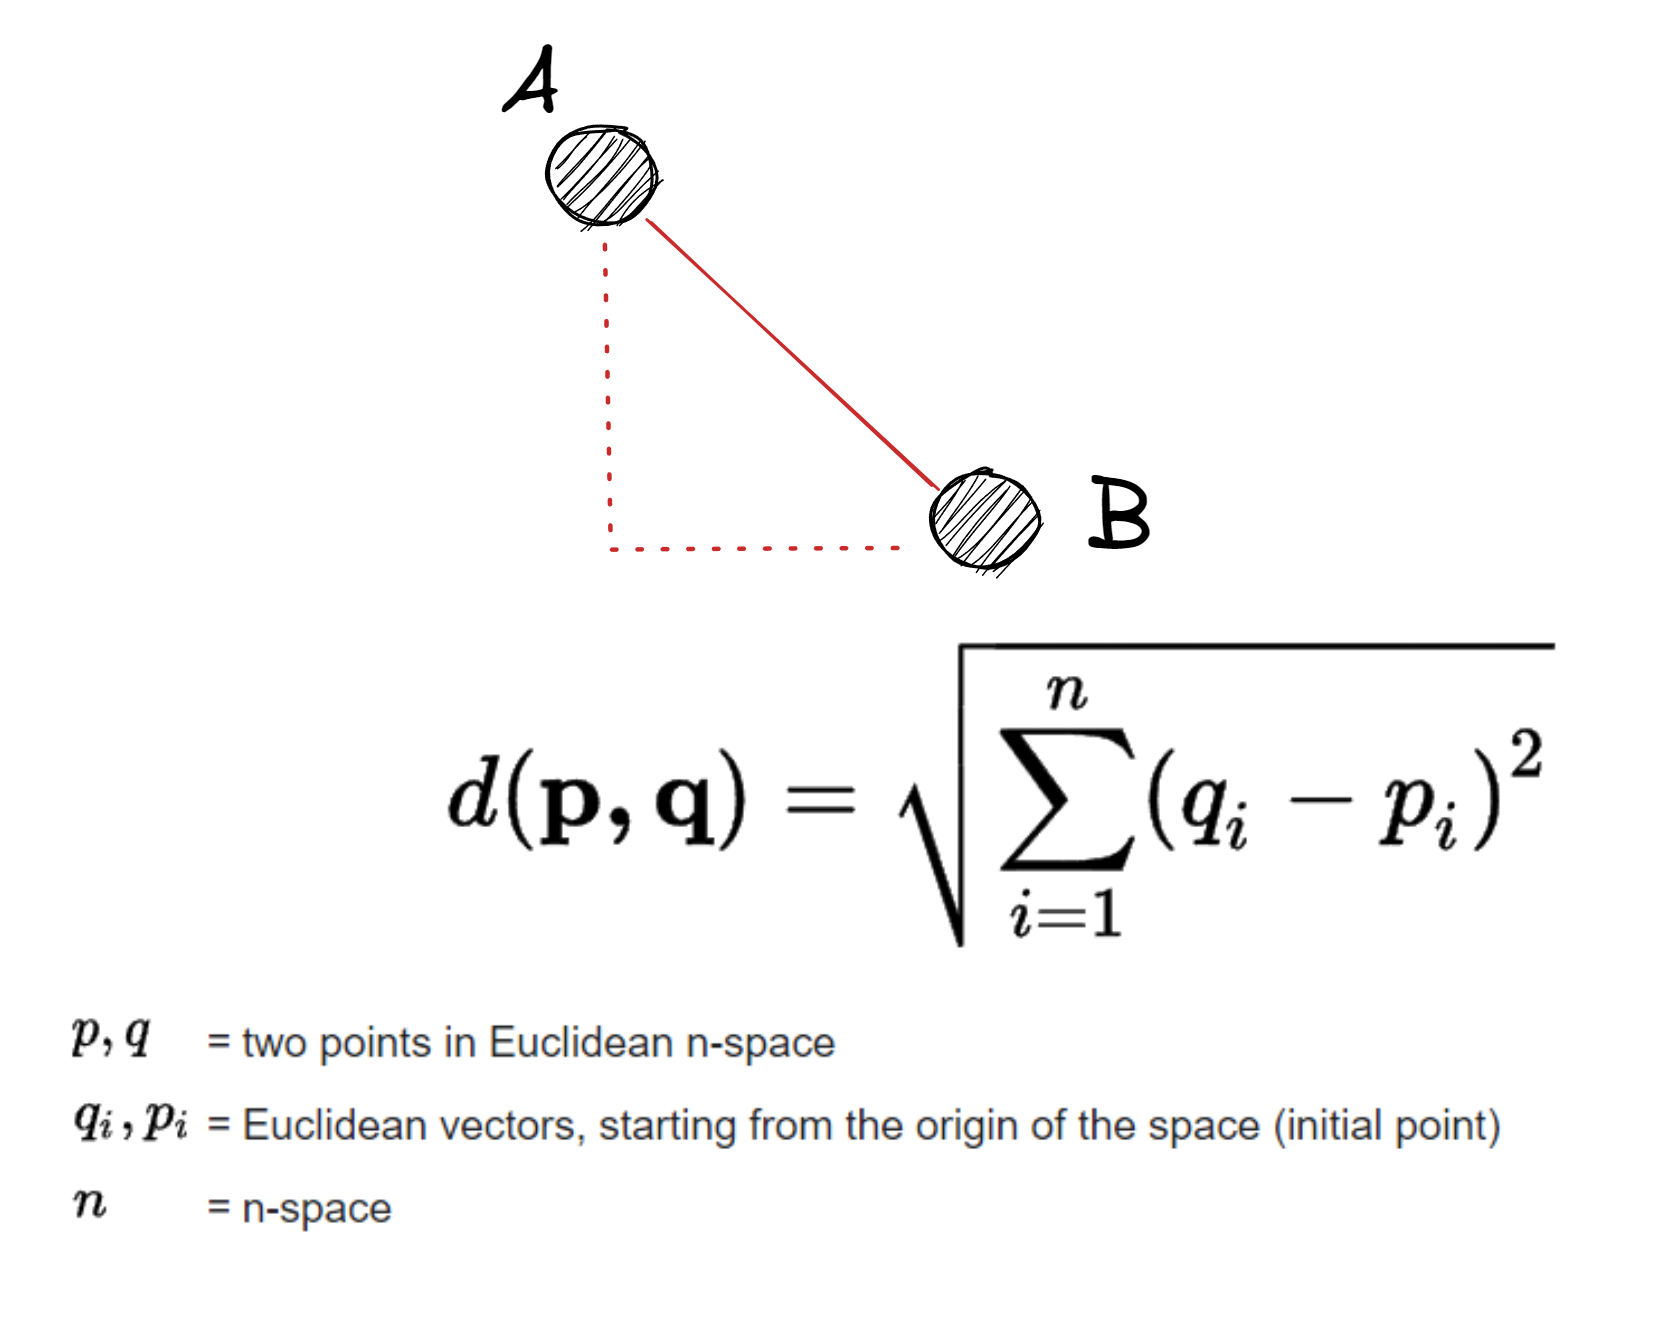
ユークリッド距離の計算式とその図解。

Anomaly Detection in Python

SciPyでのユークリッド

from scipy.spatial.distance import \
euclidean

dist_AB = euclidean(A, B)
dist_AB
91.35644476444998

ユークリッド距離の計算式とその図解。

Anomaly Detection in Python

標準化

  • 平均を引き、標準偏差で割る
  • 結果: 平均0、標準偏差1
Anomaly Detection in Python

StandardScaler

from sklearn.preprocessing import StandardScaler

ss = StandardScaler()

# 特徴量と目的変数を抽出 X = males.drop("weightkg", axis=1) y = males[['weightkg']]
# 学習 ss.fit(X)
Anomaly Detection in Python

変換

X_transformed = ss.transform(X)

X_transformed[:5]
array([[-1.05174523],
       [-0.29289108],
       [ 1.3446363 ],
       [-1.21654894],
       [0.056451235]])
Anomaly Detection in Python

fit_transform

ss = StandardScaler()

X_transformed = ss.fit_transform(X)
Anomaly Detection in Python

QuantileTransformer

from sklearn.preprocessing import QuantileTransformer


# 初期化 qt = QuantileTransformer() X = males.drop("weightkg", axis=1) y = males[['weightkg']]
X_transformed = qt.fit_transform(X) X_transformed.shape
(4082, 94)
Anomaly Detection in Python

列名を保持

qt = QuantileTransformer()

X.loc[:, :] = qt.fit_transform(X)

X.head()

Ansur男性の身体計測データを変換した最初の5行。

Anomaly Detection in Python

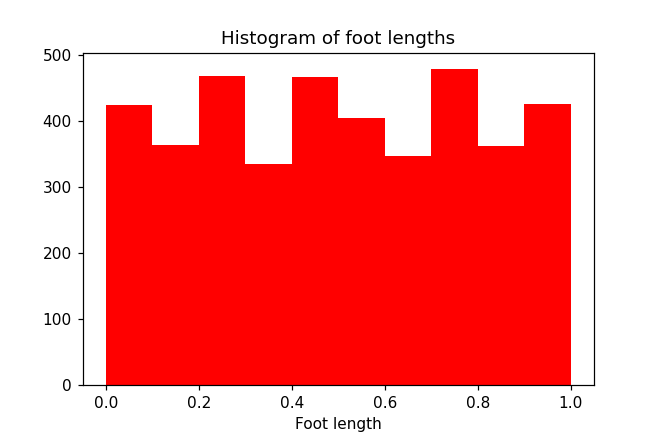
一様なヒストグラム

plt.hist(X['footlength'], color='red')

plt.xlabel("Foot length")
plt.title("Histogram of foot lengths")

plt.show()

一様分布を示すfoot length列のヒストグラム

Anomaly Detection in Python

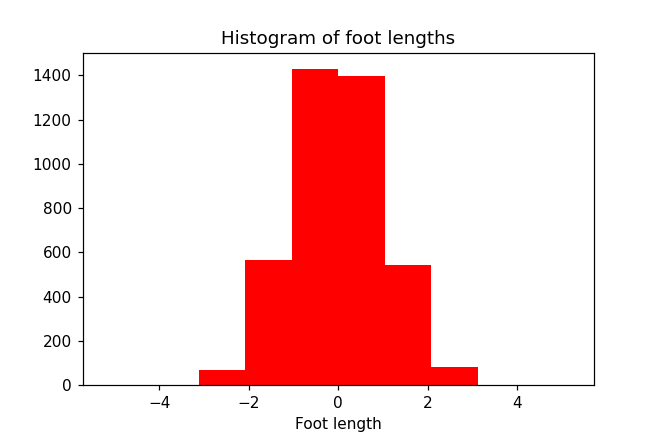
正規的なヒストグラム

qt = QuantileTransformer(
  output_distribution='normal')

# 上書きした特徴量配列を再作成
X = males.drop("weightkg", axis=1)
X.loc[:, :] = qt.fit_transform(X)

plt.hist(X['footlength'], color='r')
plt.xlabel("Foot length")
plt.title("Histogram of foot lengths")

plt.show()

正規分布に近い分布を示すfoot length列のヒストグラム

Anomaly Detection in Python

練習しましょう!

Anomaly Detection in Python

Preparing Video For Download...