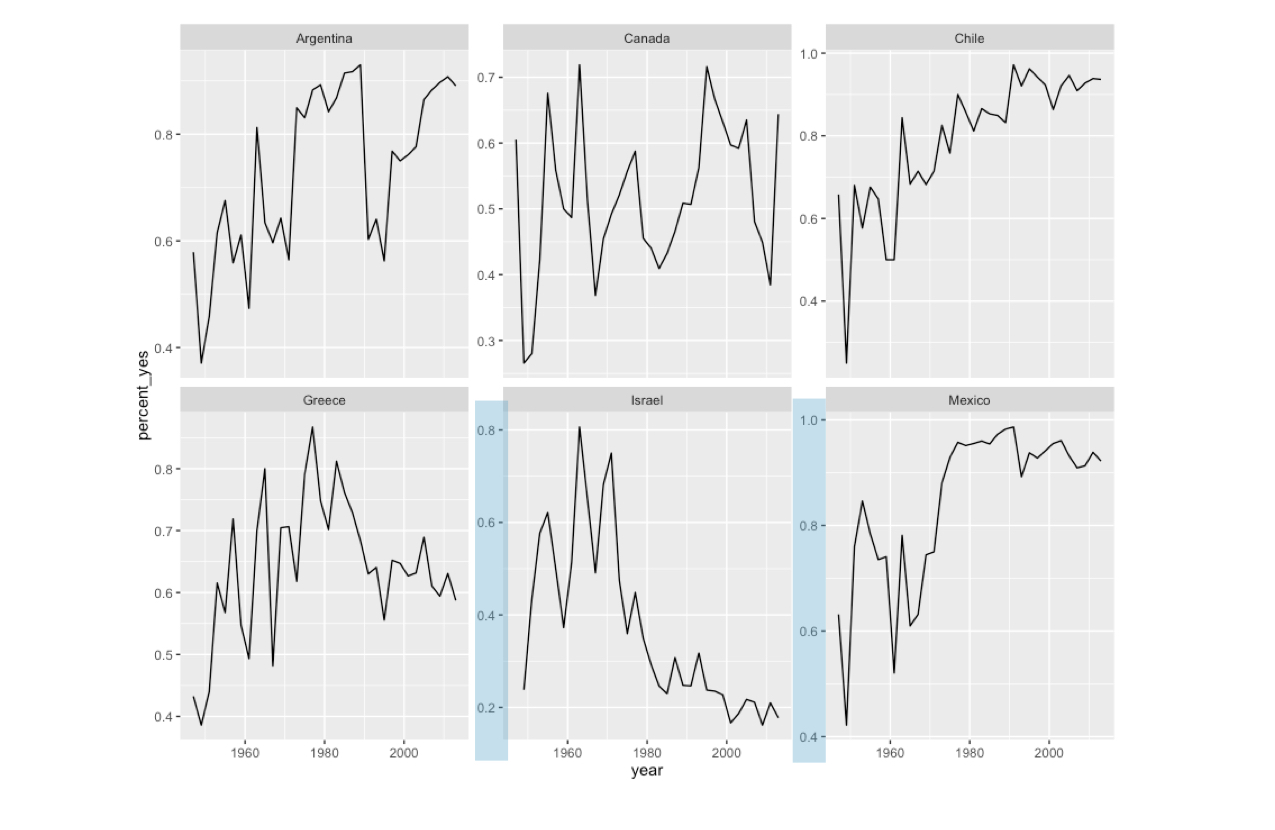
国別のファセット化
ケーススタディ:Rで行う探索的データ分析

Dave Robinson
Chief Data Scientist, DataCamp
複数国の可視化
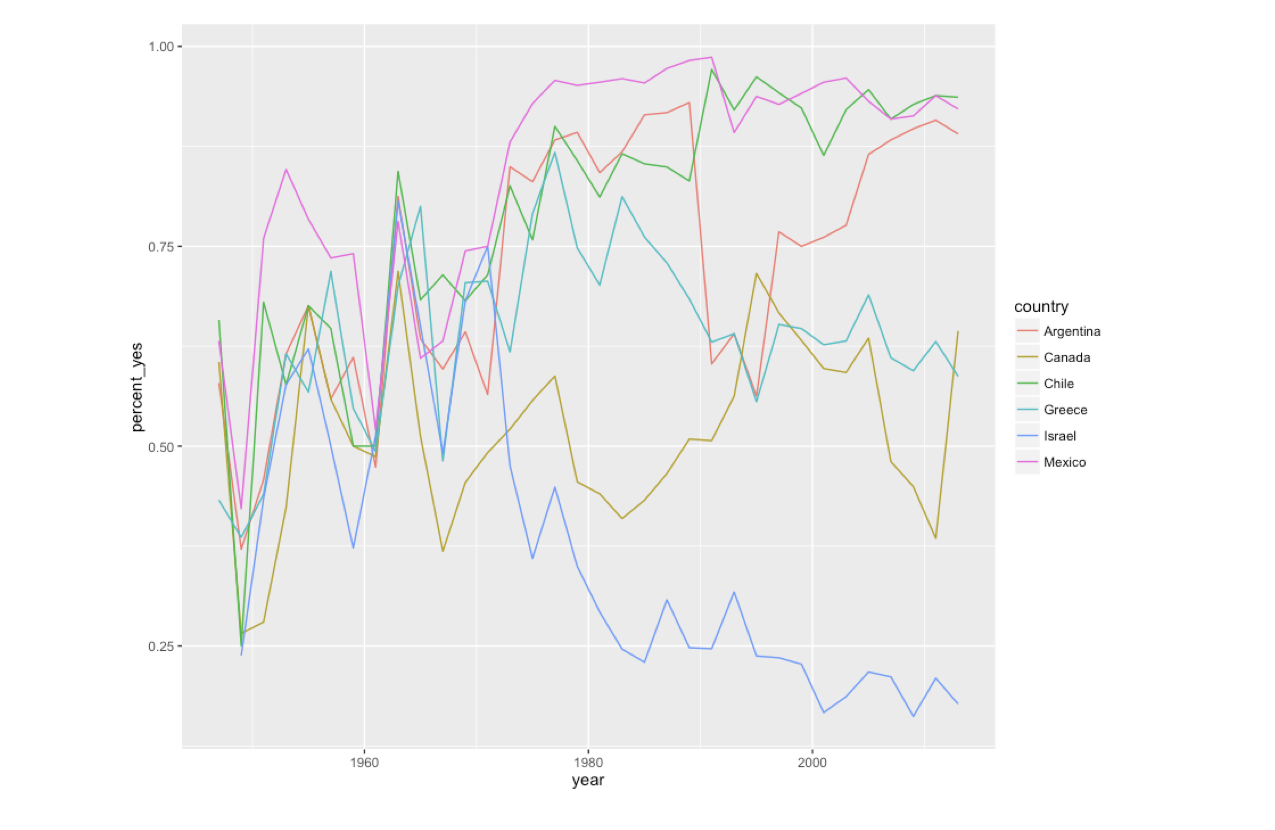
複数国の可視化
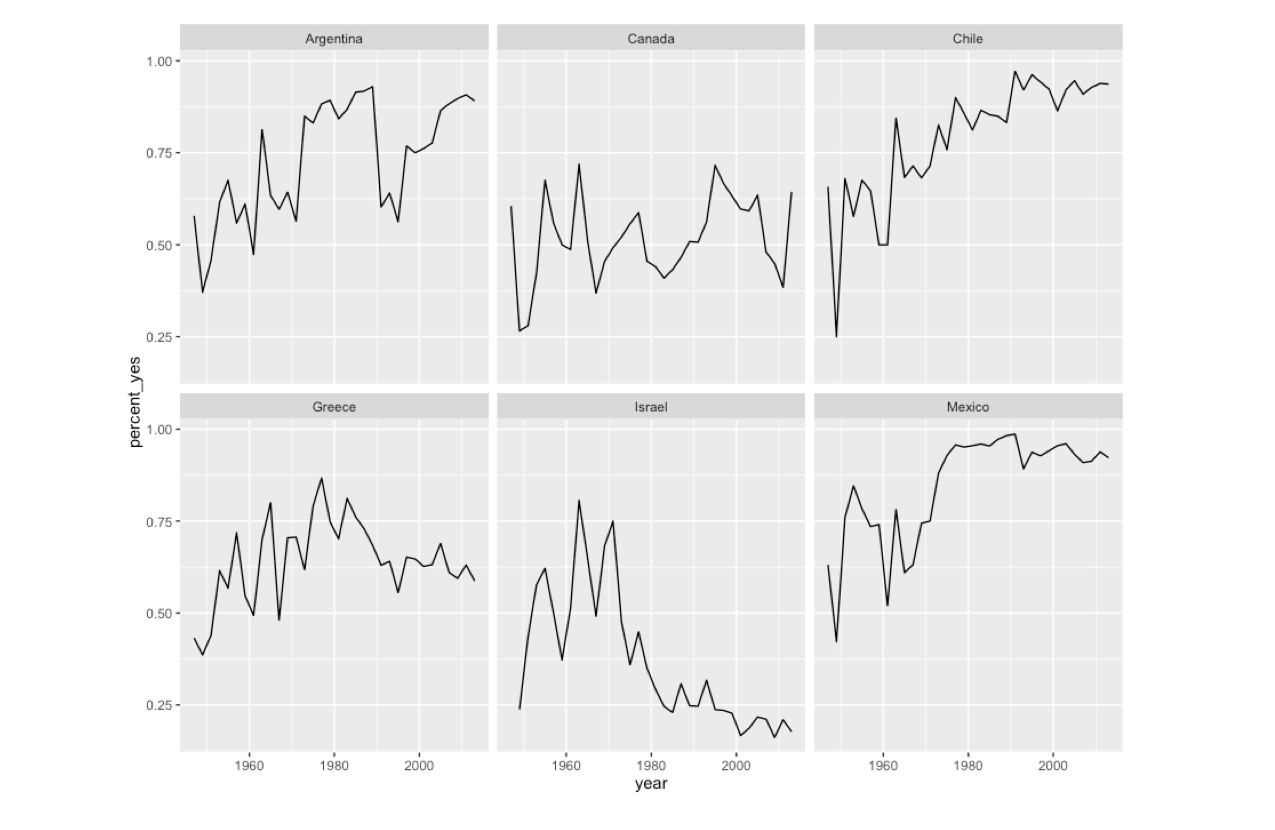
ggplot(many_countries, aes(year, percent_yes)) +
  geom_line() +
  facet_wrap(~ country)
別スケールでの可視化
ggplot(many_countries, aes(year, percent_yes)) +
  geom_line() +
  facet_wrap(~ country, scales = "free_y")
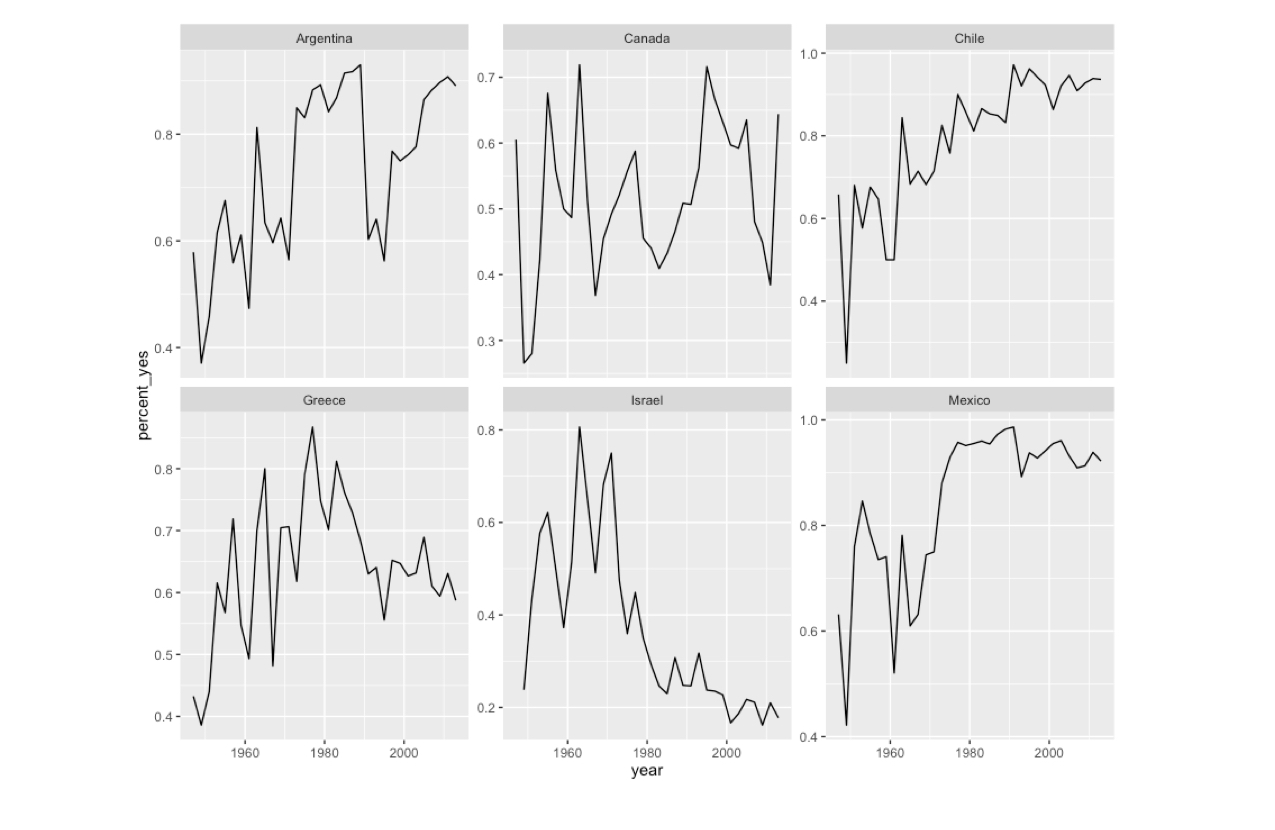
別スケールでの可視化
ggplot(many_countries, aes(year, percent_yes)) +
  geom_line() +
  facet_wrap(~ country, scales = "free_y")
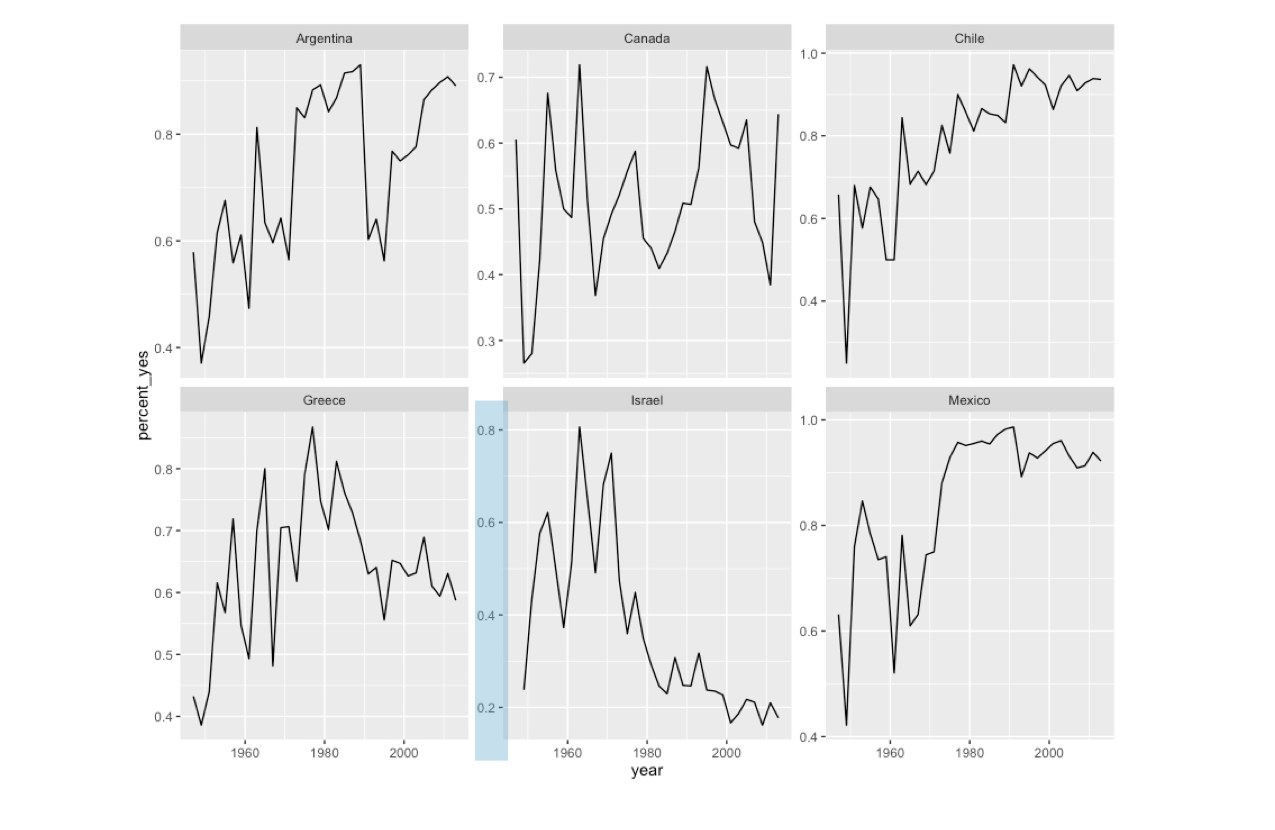
別スケールでの可視化
ggplot(many_countries, aes(year, percent_yes)) +
  geom_line() +
  facet_wrap(~ country, scales = "free_y")