複数銘柄を取得し、MultiIndex を管理

Pythonでの金融データのインポートと管理

Stefan Jansen

Instructor

複数銘柄のデータを取得

  • 上場情報を使って複数銘柄を選択
    • 例: セクターごとの時価総額上位3社
  • Yahoo! Finance で複数銘柄のデータを取得
  • 複雑なデータに有効な pandasMultiIndex の扱いを学習
Pythonでの金融データのインポートと管理

上位5社の株価を読み込む

nasdaq = pd.read_excel('listings.xlsx', sheet_name='nasdaq', na_values='n/a')

nasdaq.set_index('Stock Symbol', inplace=True)
top_5 = nasdaq['Market Capitalization'].nlargest(n=5) # 上位5社 top_5.div(1000000) # 時価総額(百万USD)
AAPL     740024.467000
GOOG     569426.124504
...      ...
Name: Market Capitalization, dtype: float64
tickers = top_5.index.tolist() # インデックスをリスト化
['AAPL', 'GOOG', 'MSFT', 'AMZN', 'FB']
Pythonでの金融データのインポートと管理

上位5社の株価を読み込む

df = DataReader(tickers, 'yahoo', start=date(2020, 1, 1))
<class 'pandas.core.frame.DataFrame'>
DatetimeIndex: 712 entries, 2020-01-02 to 2022-10-27
Data columns (total 30 columns):
 #   Column             Non-Null Count  Dtype  
 --  ------             --------------  -----  
 0   (Adj Close, AAPL)  712 non-null    float64
 1   (Adj Close, GOOG)  712 non-null    float64
 2   (Adj Close, MSFT)  712 non-null    float64
...
 28  (Volume, AMZN)     712 non-null    float64
 29  (Volume, FB)       253 non-null    float64
dtypes: float64(30)
memory usage: 172.4 KB
df = df.stack()
Pythonでの金融データのインポートと管理

上位5社の株価を読み込む

df.info()
MultiIndex: 3101 entries, (Timestamp('2020-01-02 00:00:00'), 'AAPL') to (Timestamp('2022-10-27 00:00:00'), 'FB')
Data columns (total 6 columns):
 #   Column     Non-Null Count  Dtype  
 --  ------     --------------  -----  
 0   Adj Close  3101 non-null   float64
...
Pythonでの金融データのインポートと管理

データの整形: .unstack()

unstacked = df['Close'].unstack()
unstacked.info()
DatetimeIndex: 712 entries, 2020-01-02 to 2022-10-27
Data columns (total 5 columns):
 #   Column  Non-Null Count  Dtype  
 --  ------  --------------  -----  
 0   AAPL    712 non-null    float64
 1   GOOG    712 non-null    float64
 2   MSFT    712 non-null    float64
 3   AMZN    712 non-null    float64
 4   FB      253 non-null    float64
dtypes: float64(5)
memory usage: 33.4 KB
Pythonでの金融データのインポートと管理

ロング形式からワイド形式へ

unstacked = df['Close'].unstack() # 結果は DataFrame
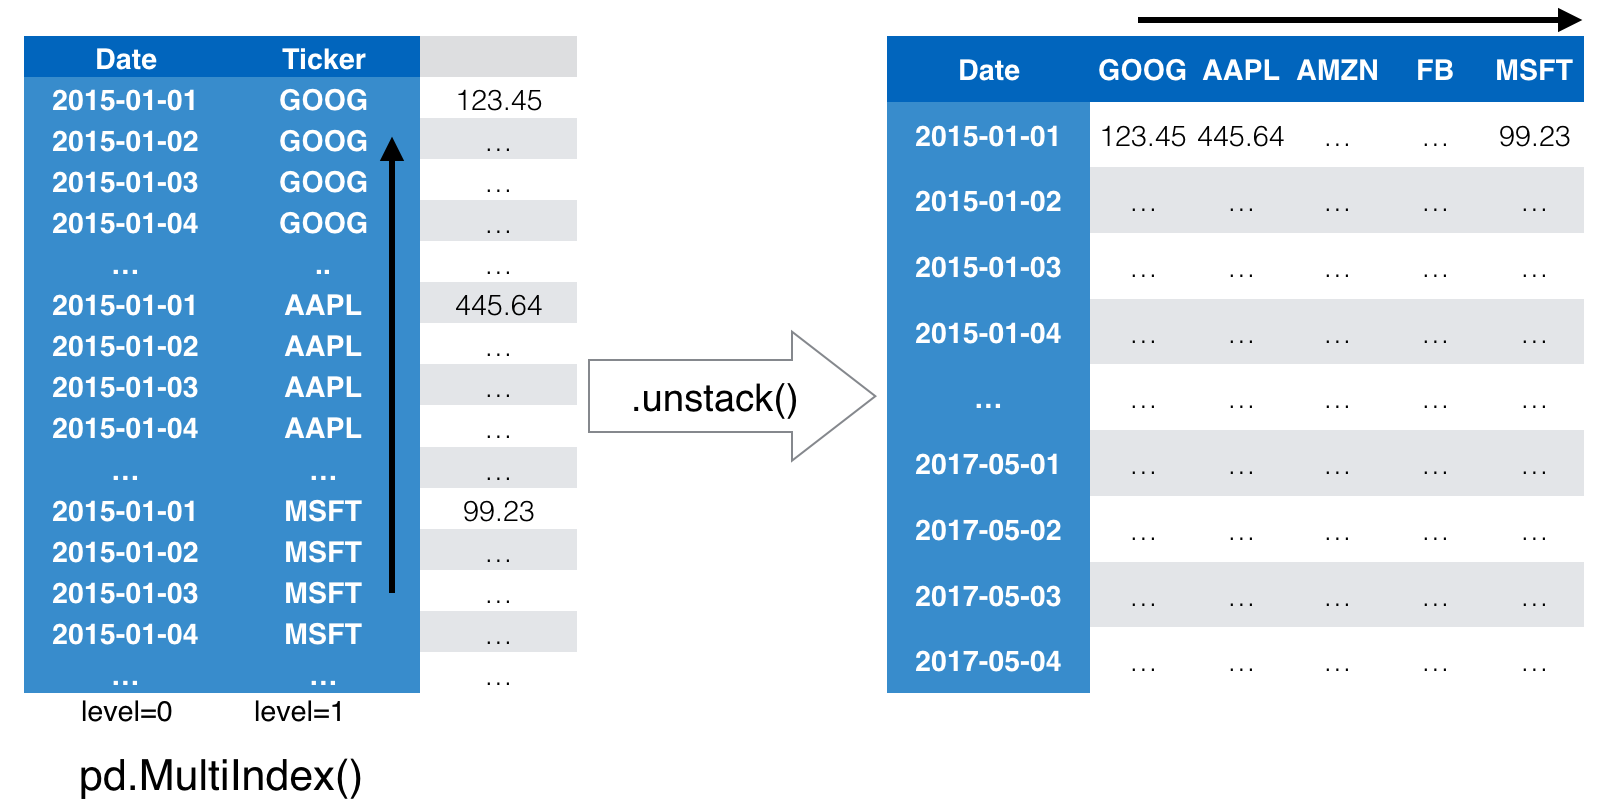
アンスタックの図

Pythonでの金融データのインポートと管理

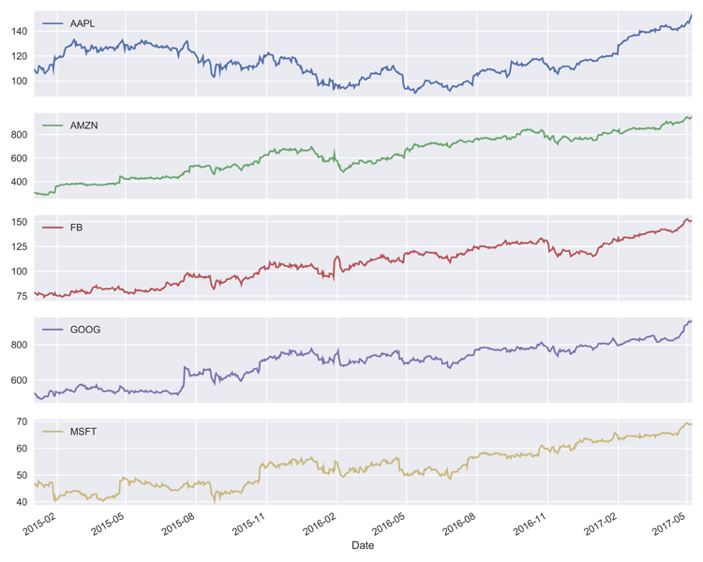
株価の可視化

unstacked.plot(subplots=True)
plt.tight_layout(); plt.show()

サブプロット

Pythonでの金融データのインポートと管理

練習しましょう!

Pythonでの金融データのインポートと管理

Preparing Video For Download...