注釈
Pythonでデータ可視化を磨く

Nick Strayer
Instructor
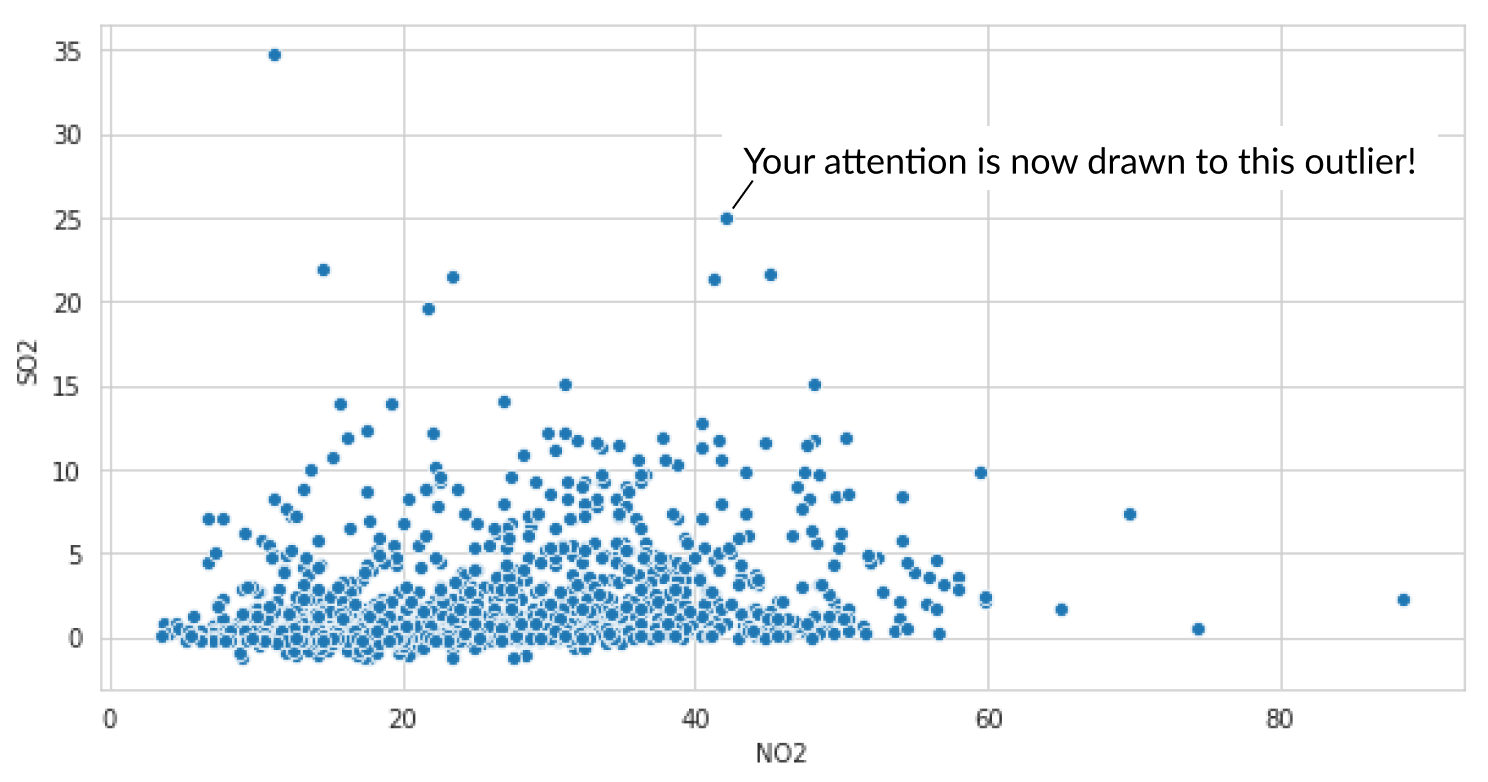
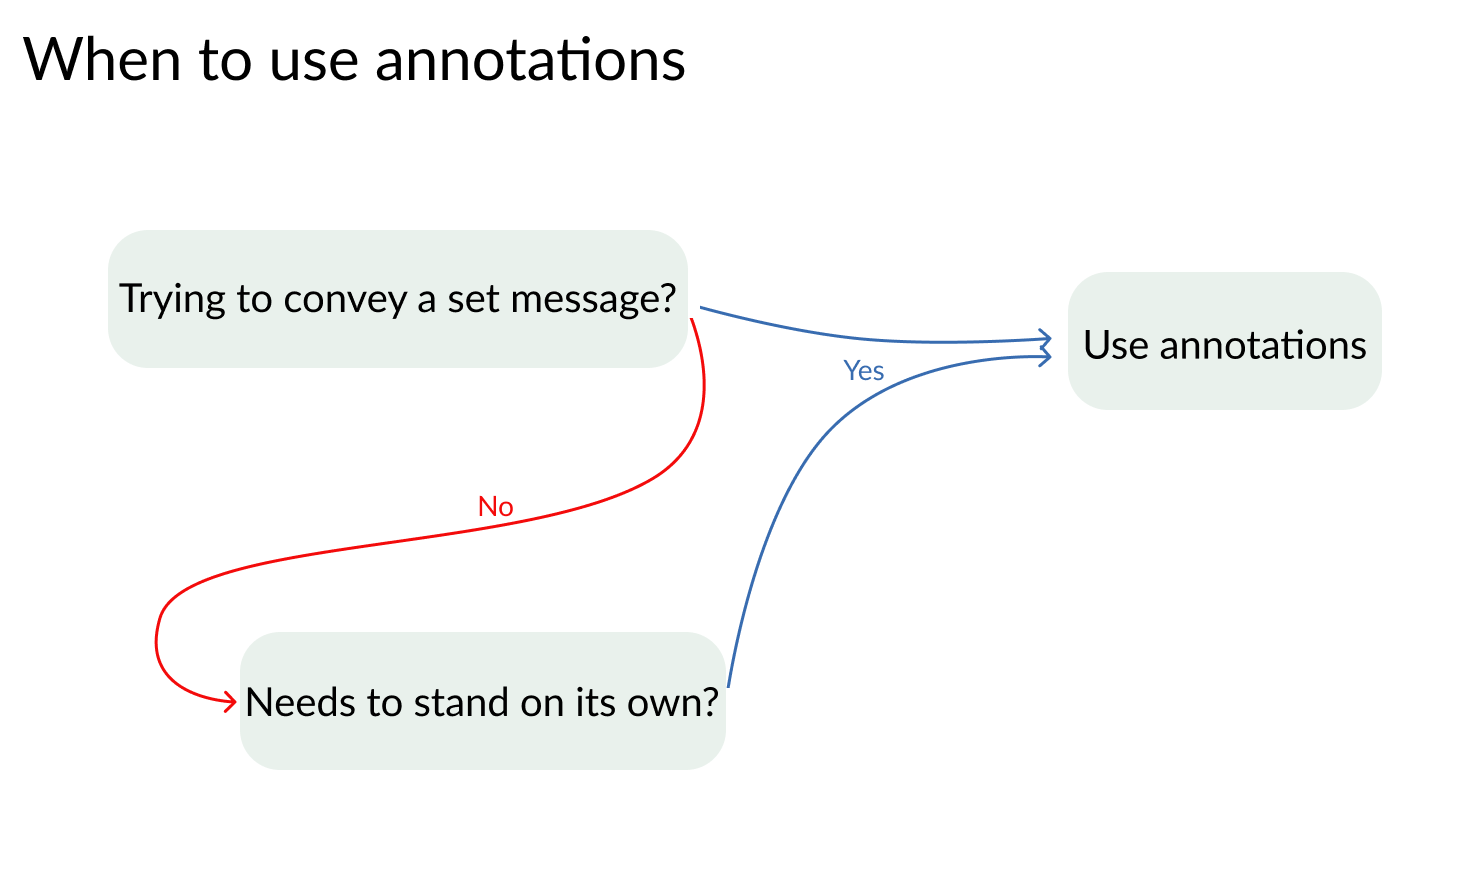
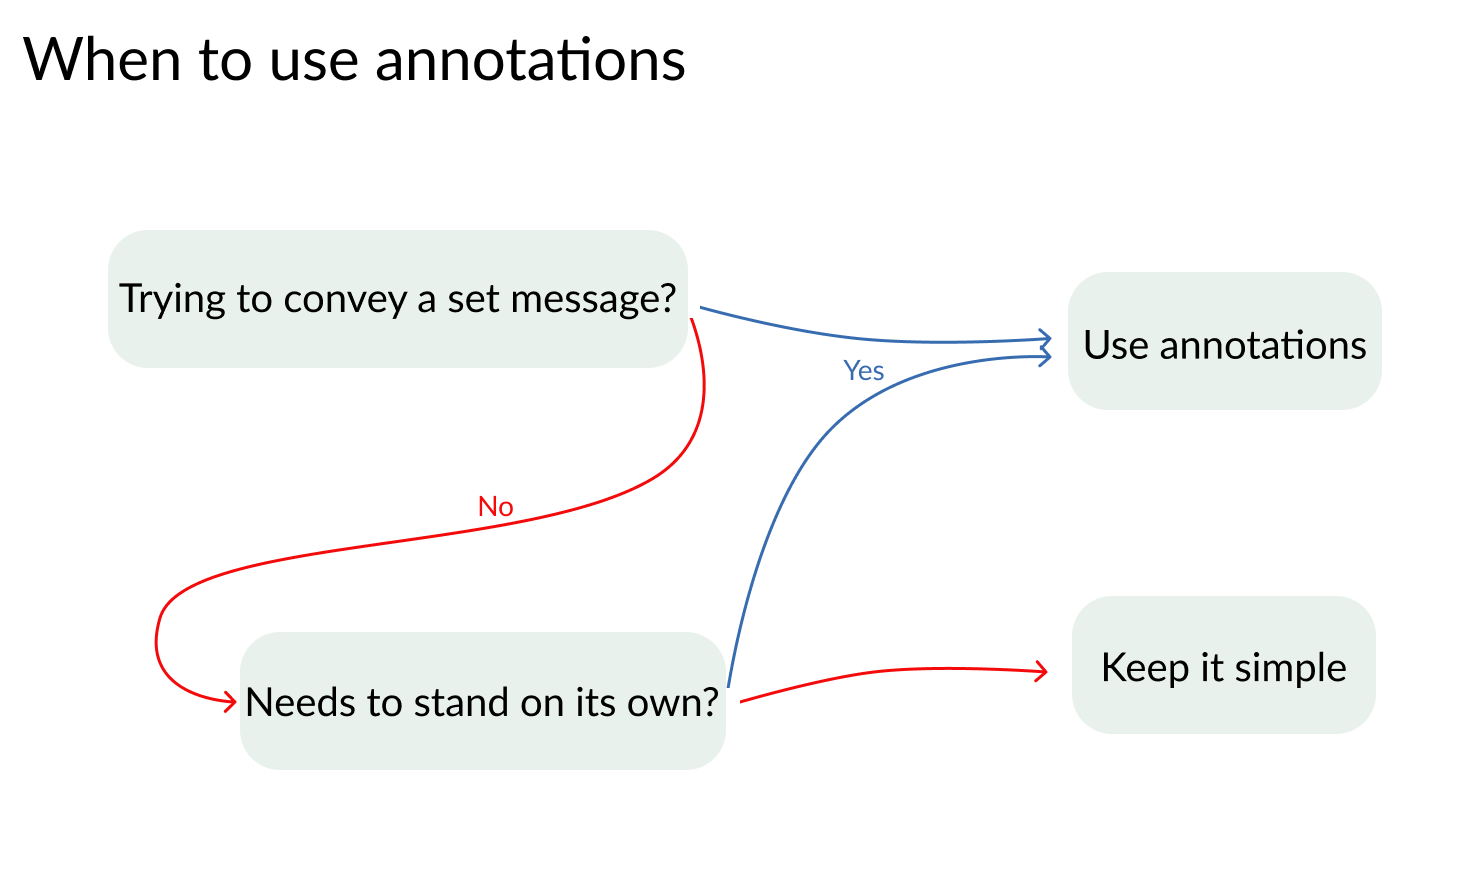
注釈の効果
- コンパクトで効率的に伝える
- データへの深い示唆を加えられる
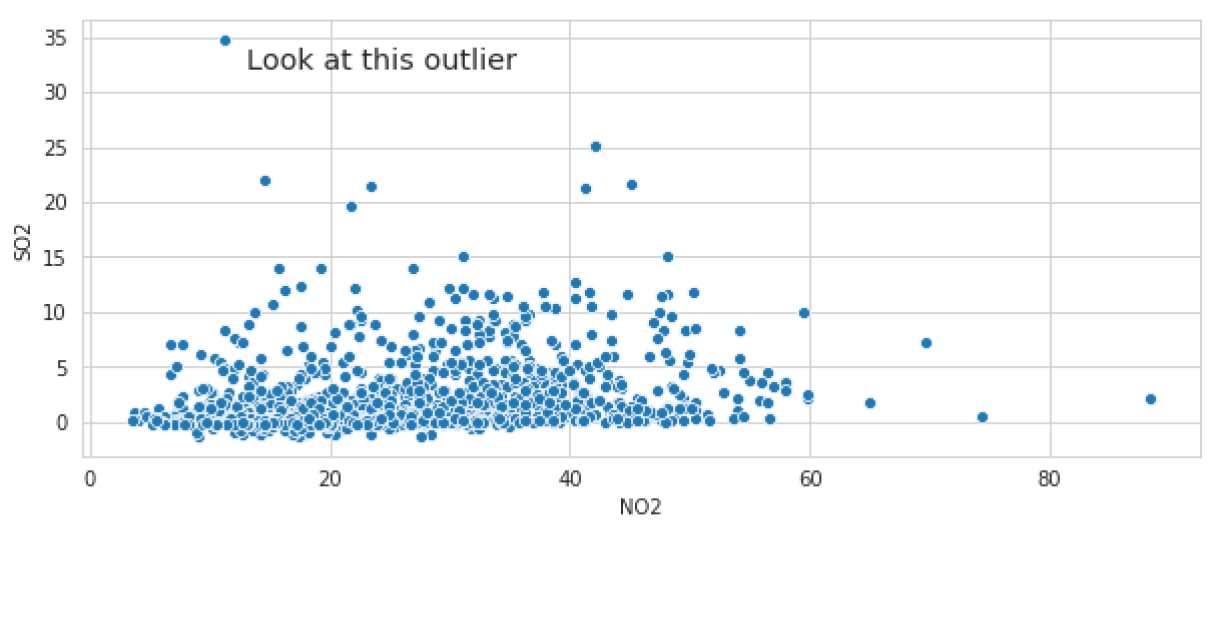
sns.scatterplot(x='NO2', y='SO2', data = houston_pollution)# X および Y の外れ値位置とテキスト plt.text(13,33,'Look at this outlier', # 位置合わせとサイズの設定 fontdict = {'ha': 'left', 'size': 'x-large'})
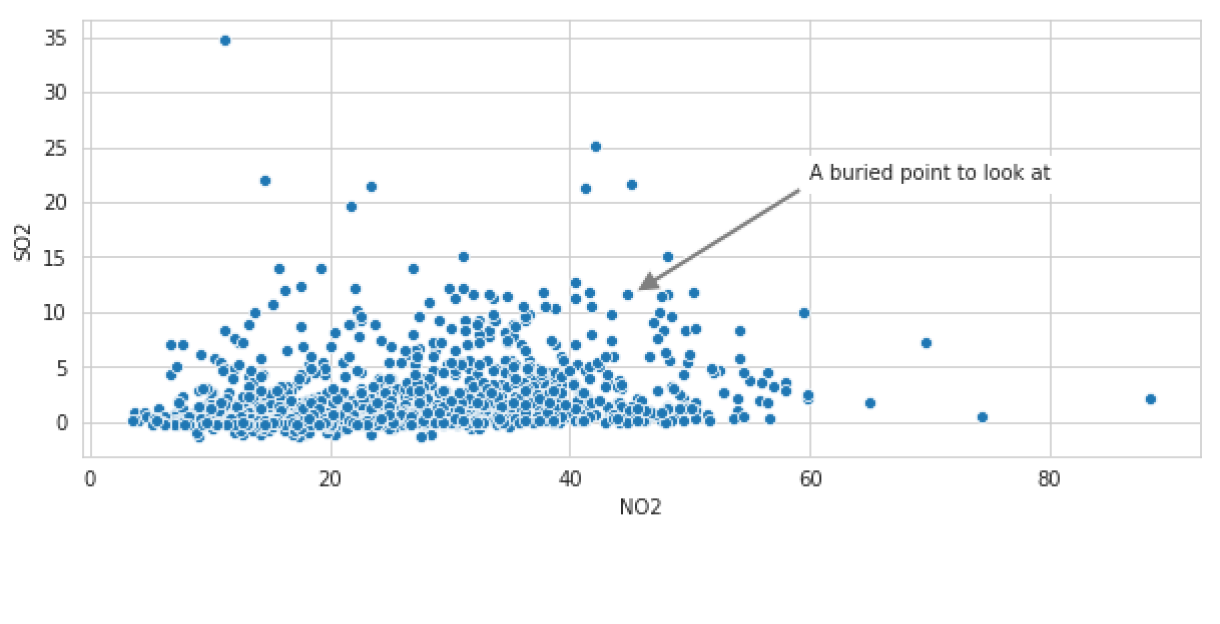
sns.scatterplot(x='NO2', y='SO2', data = houston_pollution)# 矢印の開始位置と注釈位置 plt.annotate('A buried point to look at', xy=(45.5,11.8), xytext=(60,22), # 矢印の設定と背景ボックス arrowprops={'facecolor':'grey', 'width': 3}, backgroundcolor = 'white' )