Pythonでデータ可視化を磨く
Nick Strayer
Instructor


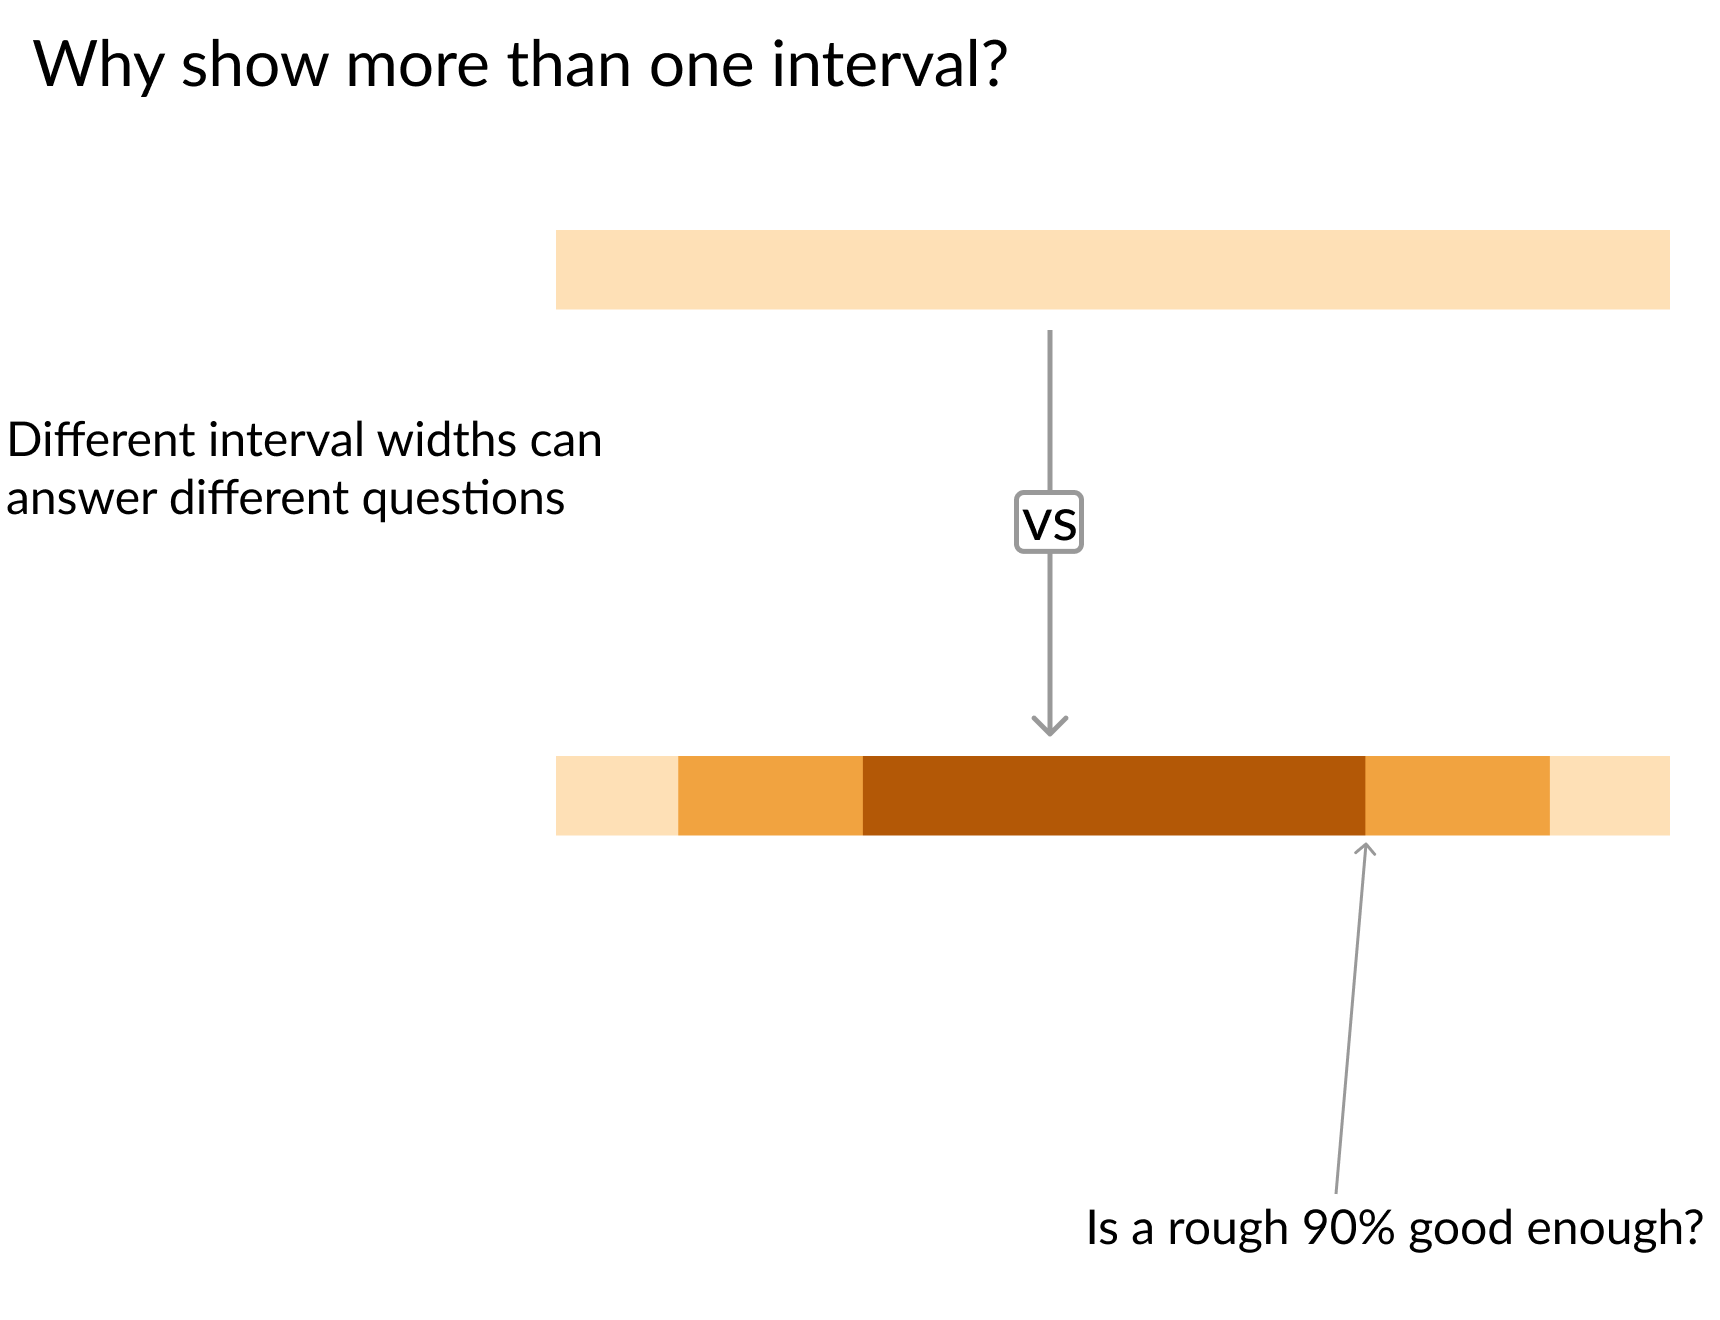
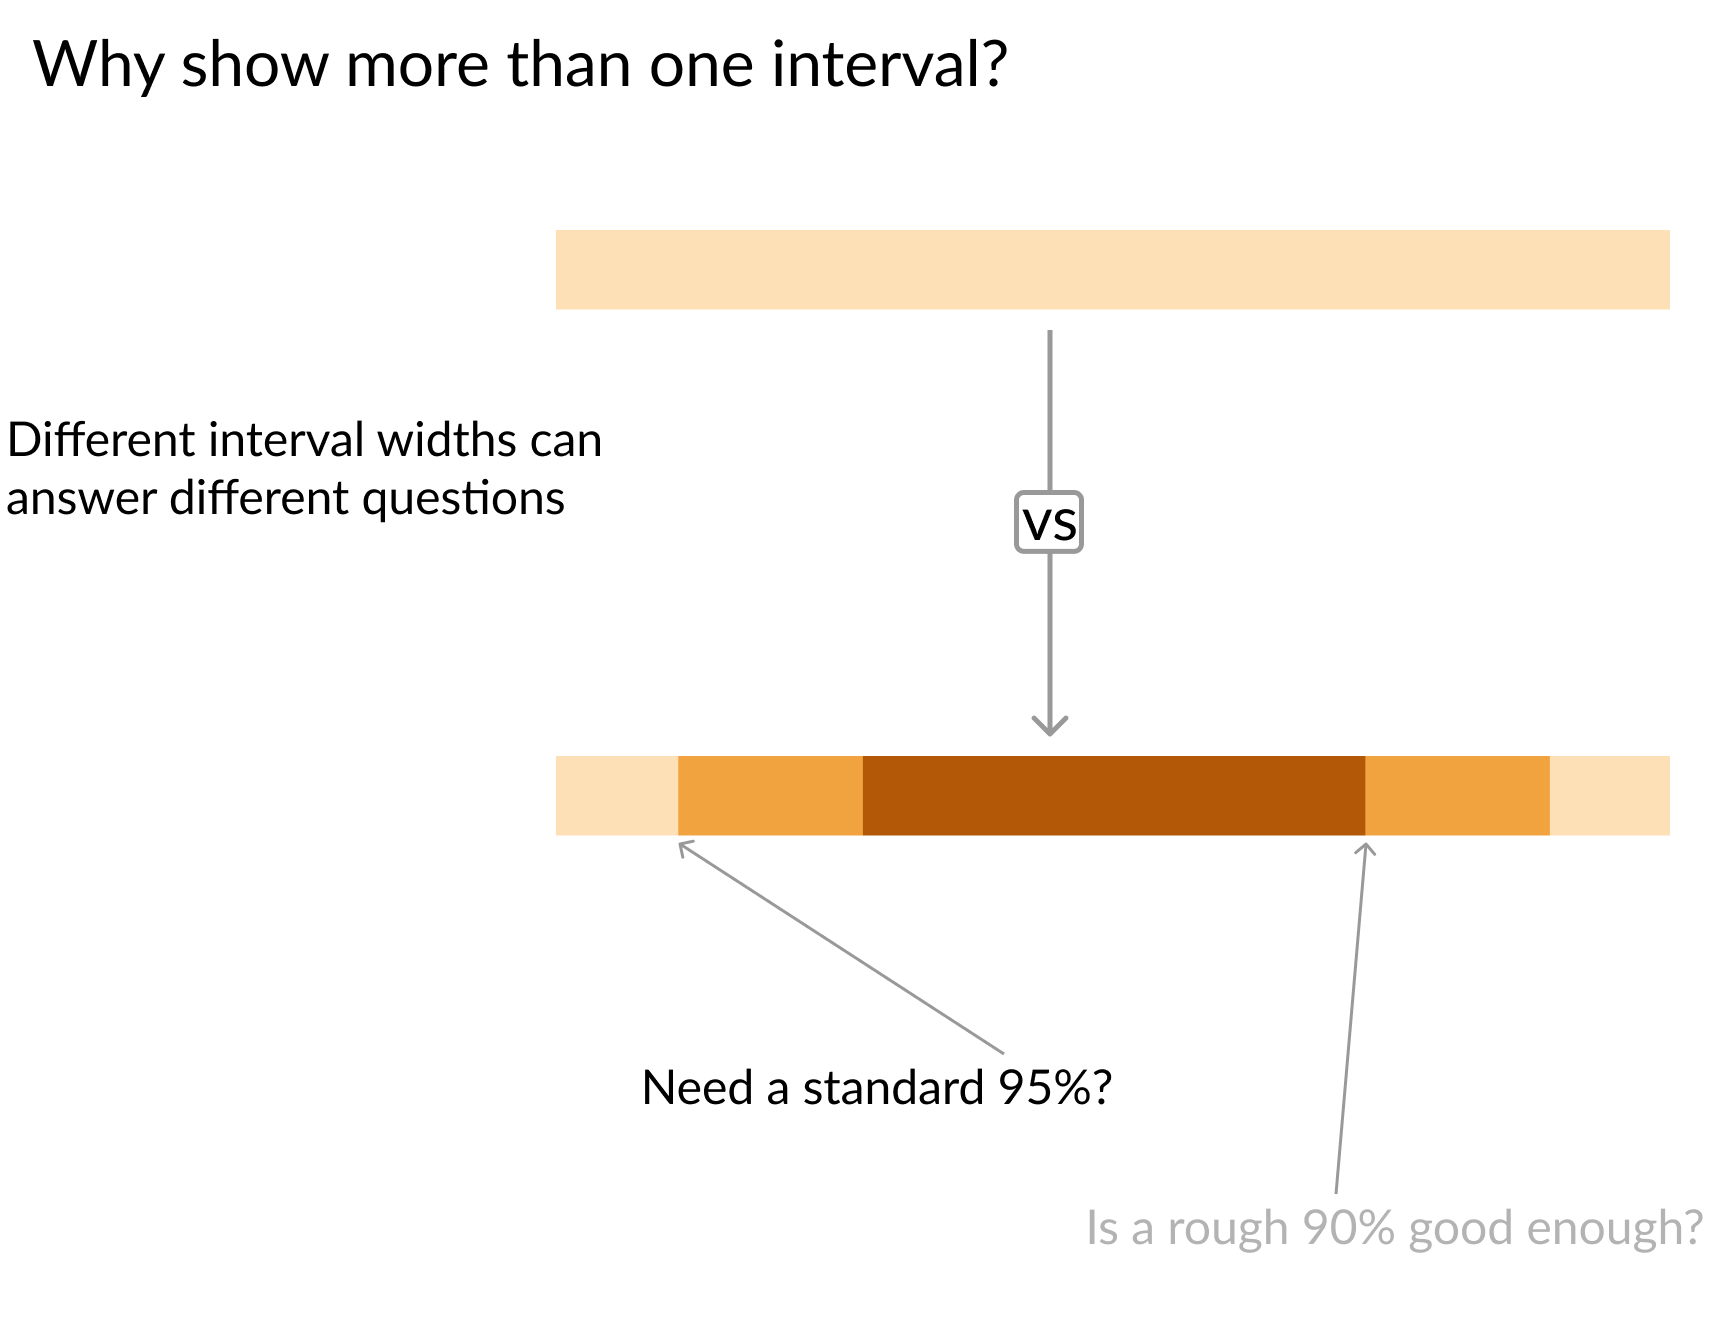
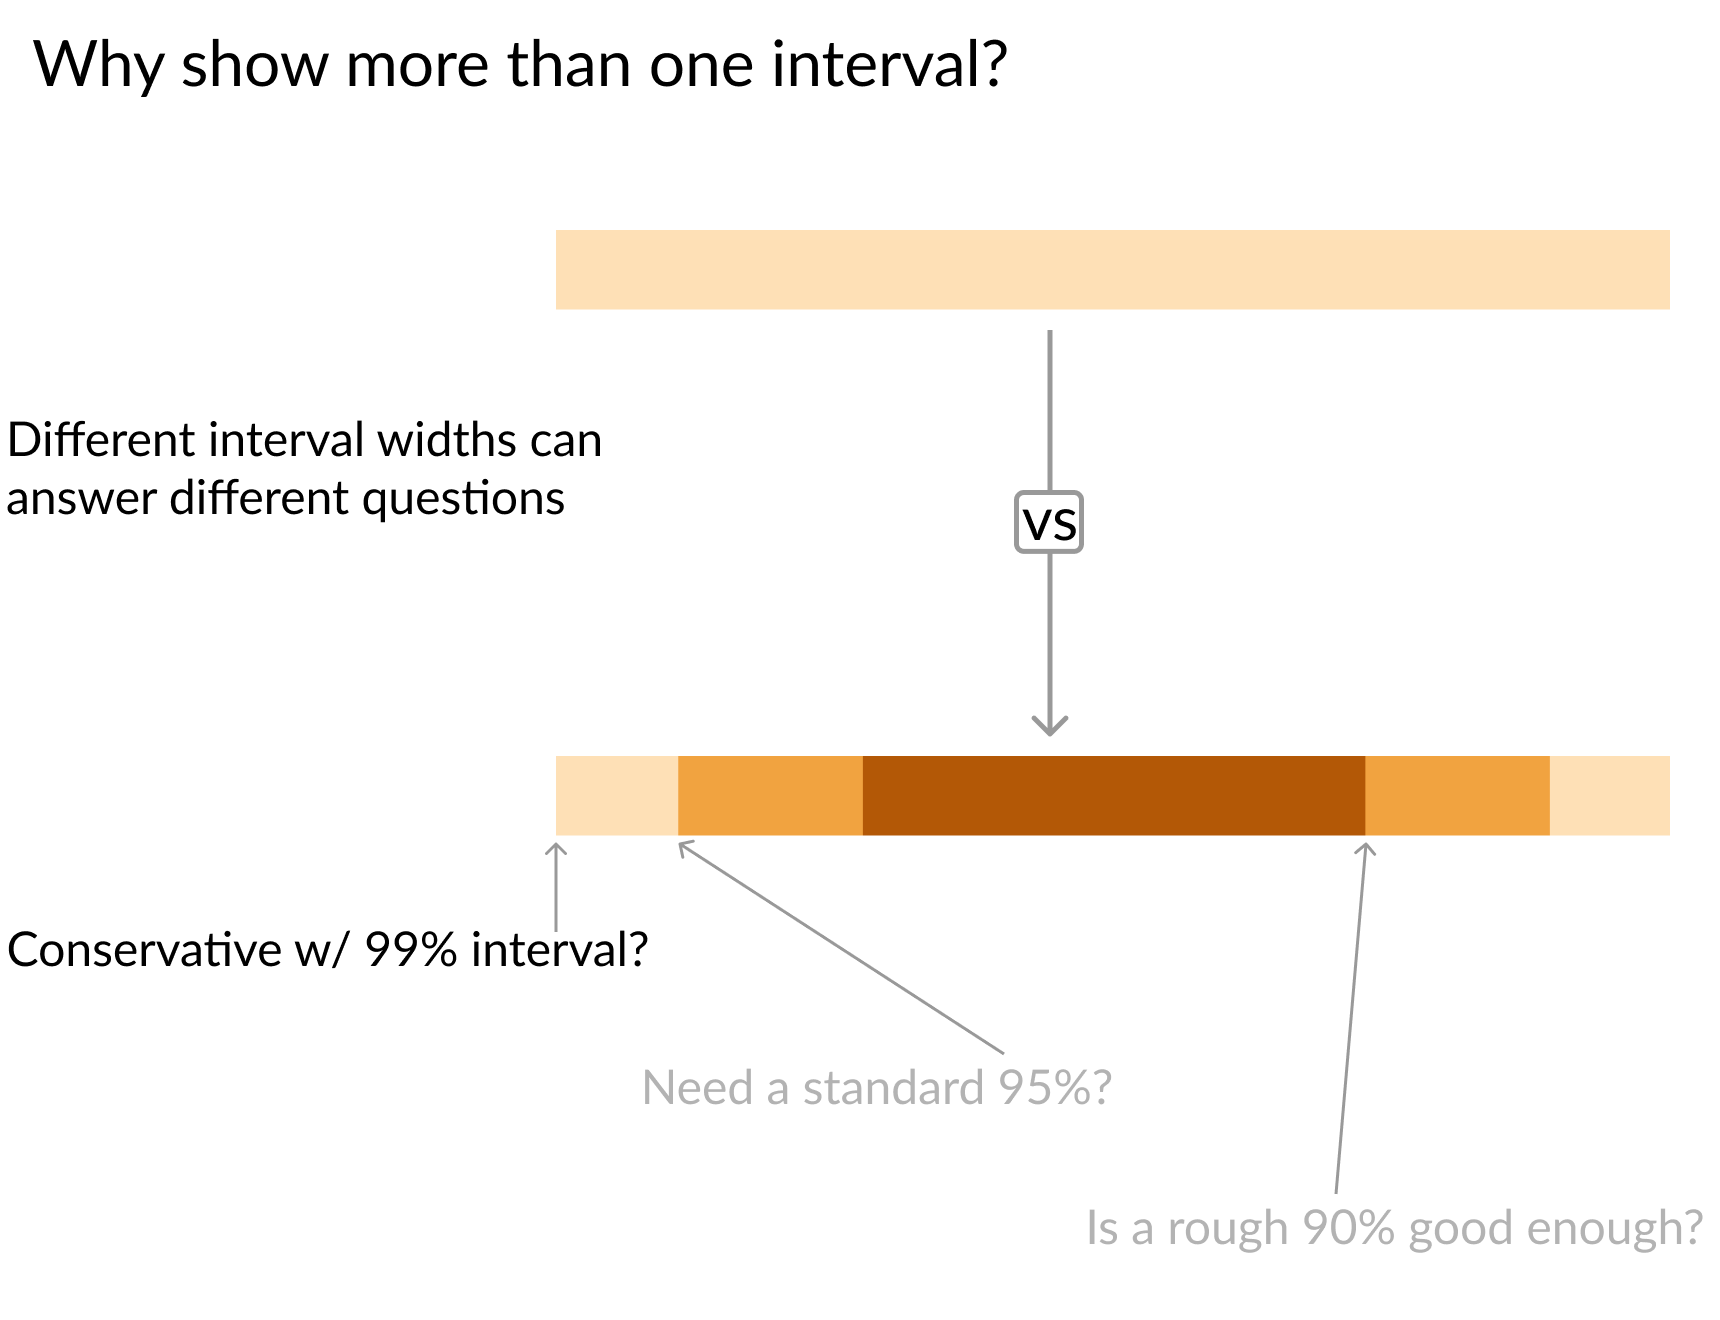
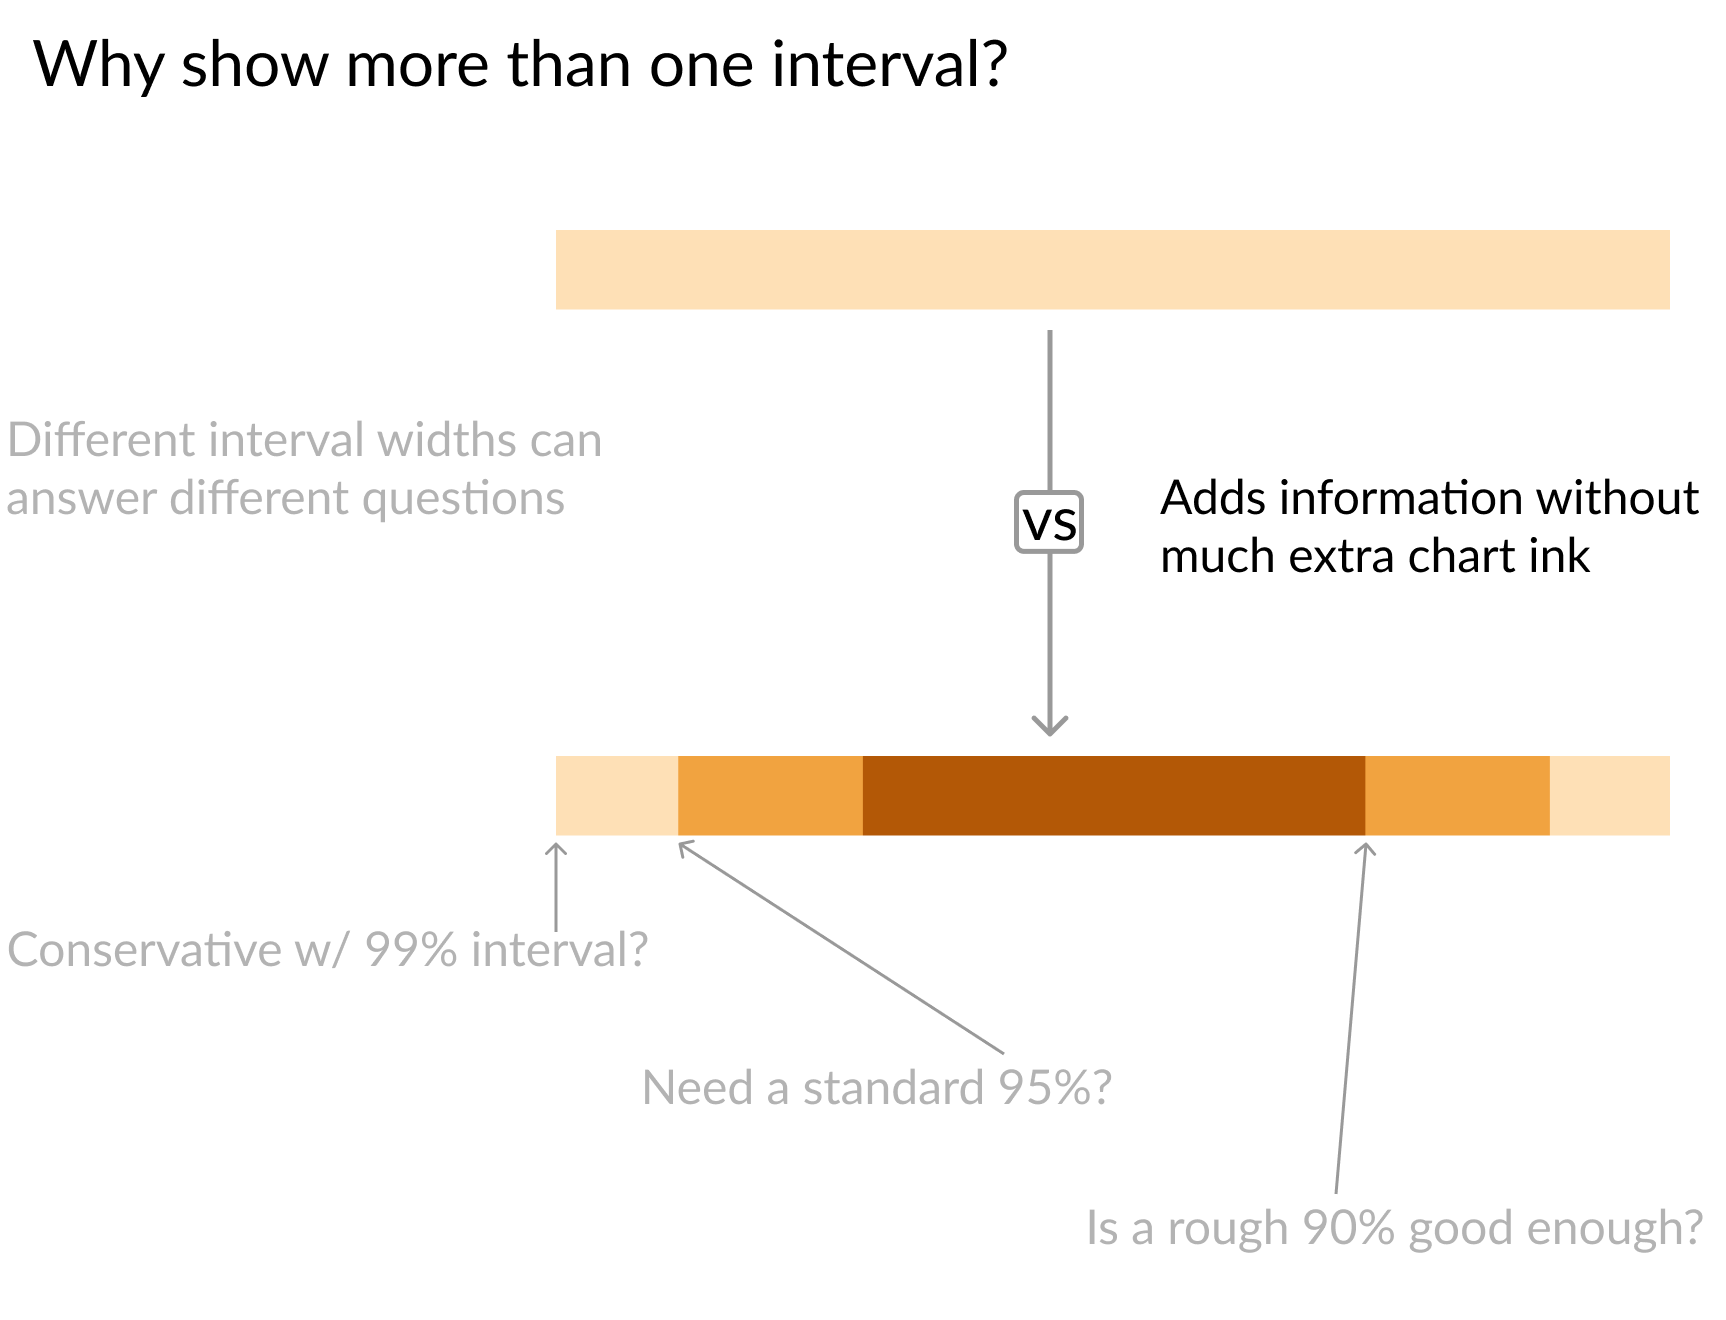
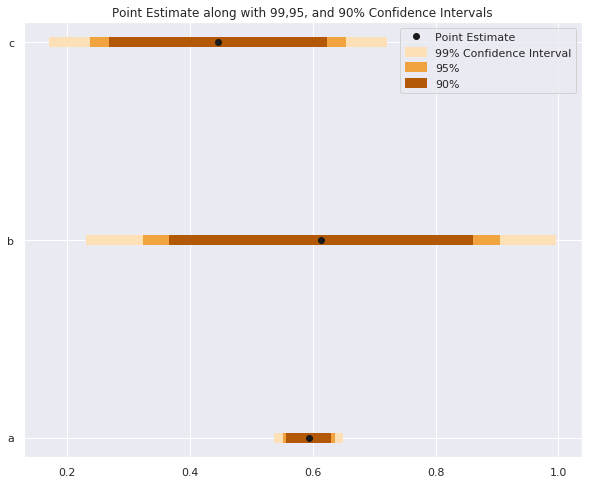
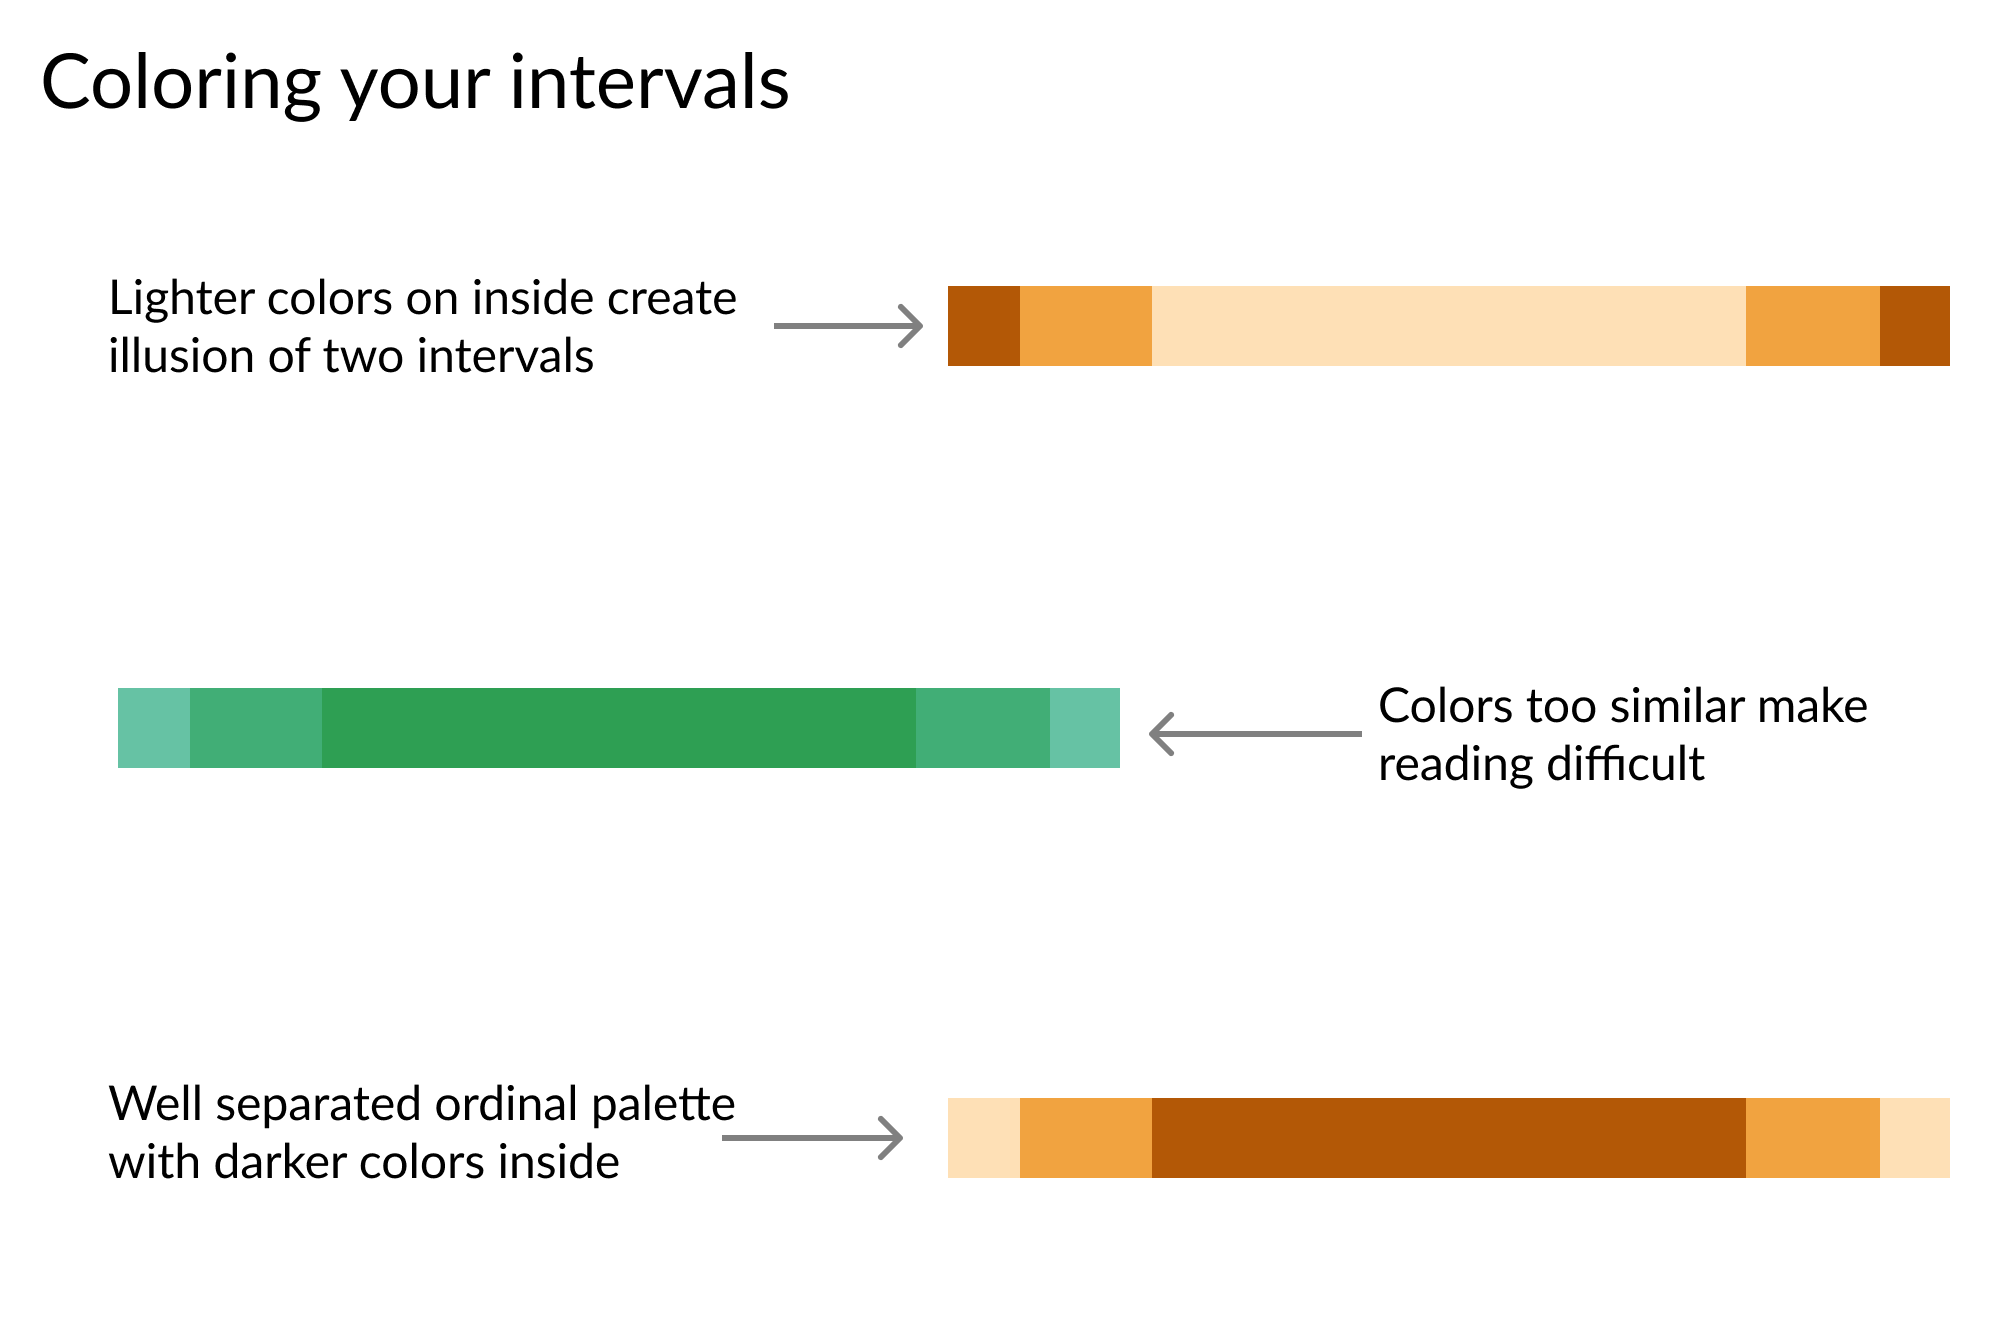
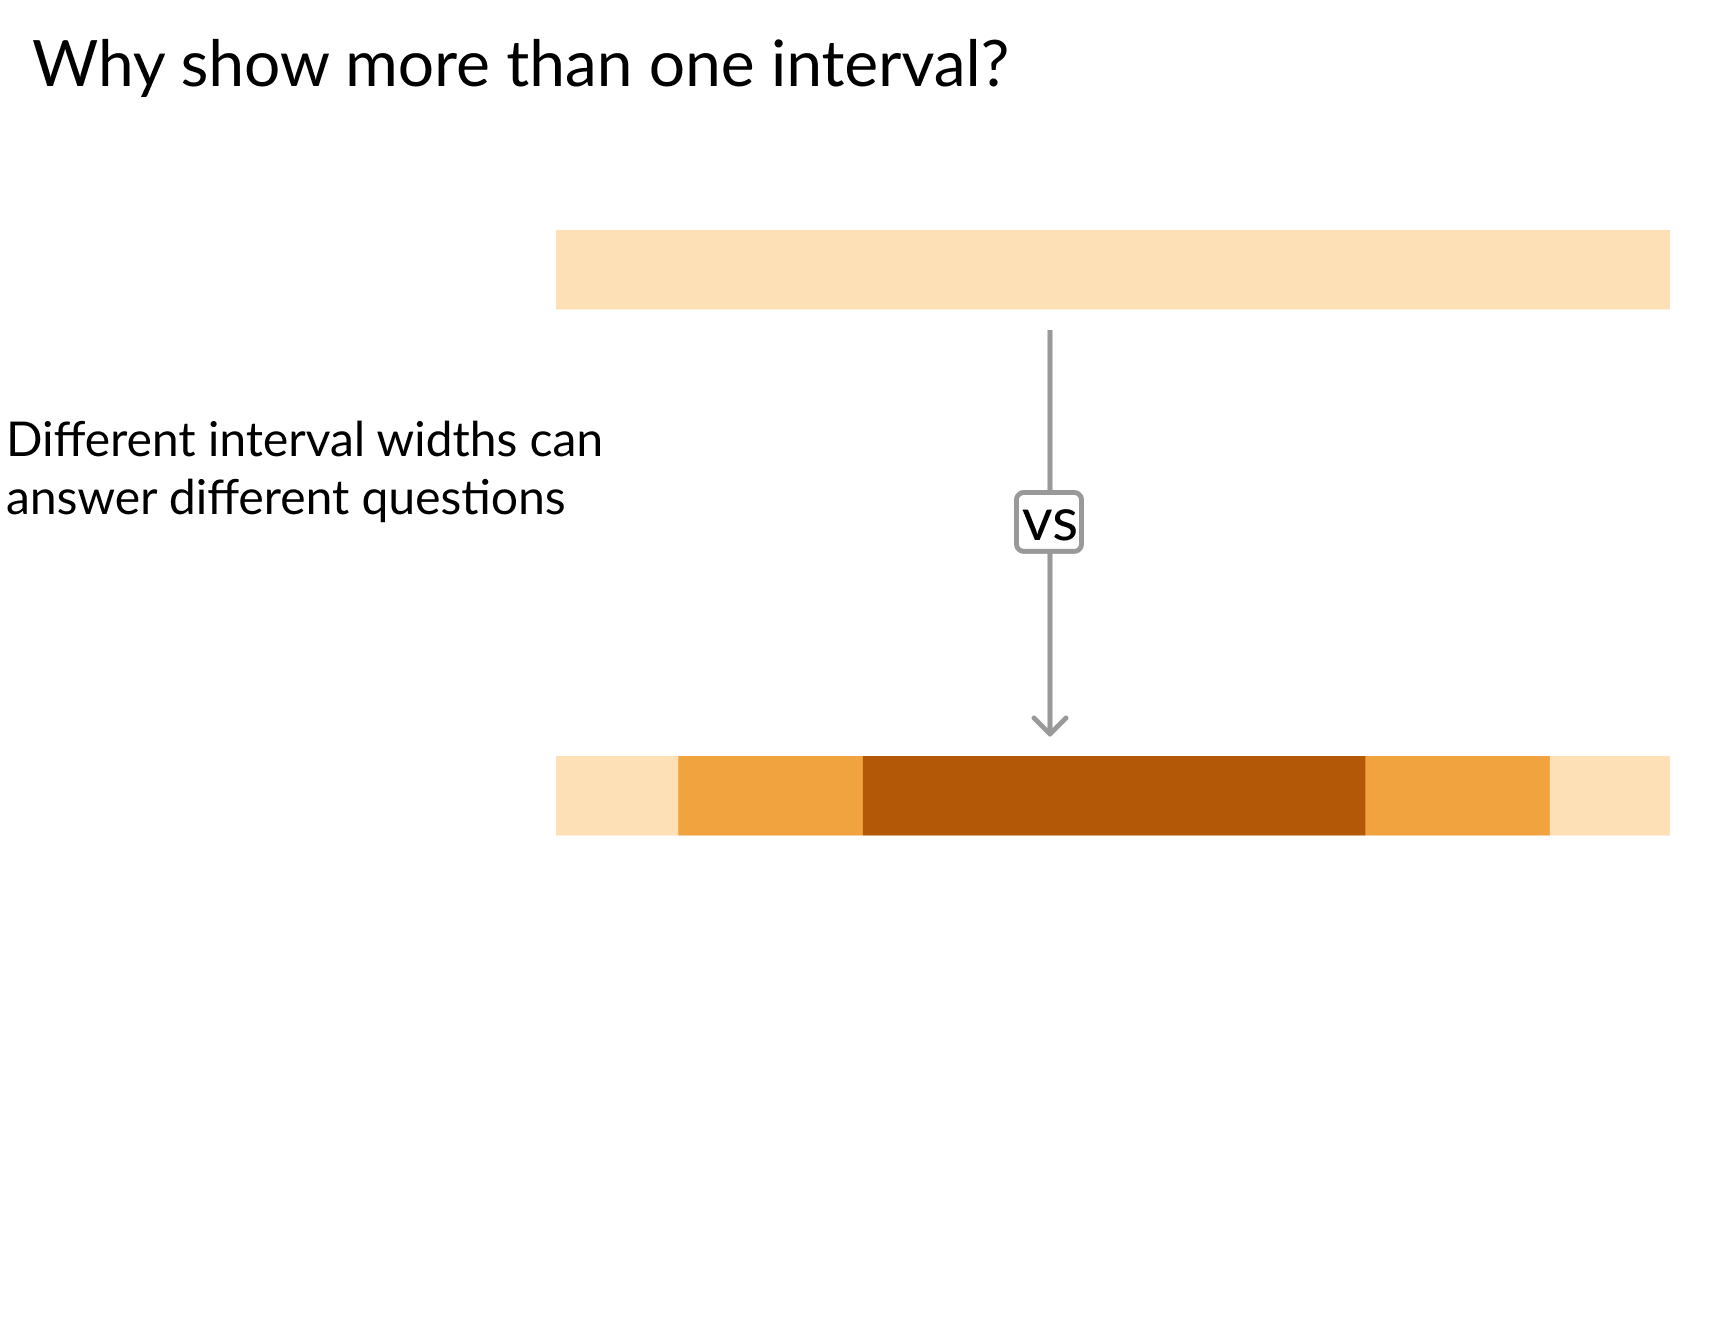
# 区間幅の設定 sizes = ['99%', '95%', '90%'] Z_scores = [2.58, 1.96, 1.67] colors = ['#fee0b6','#f1a340', '#b35806']for size, z, color in zip(sizes, Z_scores, colors): plt.hlines(y = data.y, # 下限・上限を計算 xmin = data['est'] - z*data['std_err'], xmax = data['est'] + z*data['std_err'], # 区間幅で色分け color = color,# 視認性のため線を太く linewidth = 7,# 凡例を明確にするためラベル付け label = size)plt.plot('est', 'y', 'ko', data = data, label = 'Point Estimate') plt.legend()


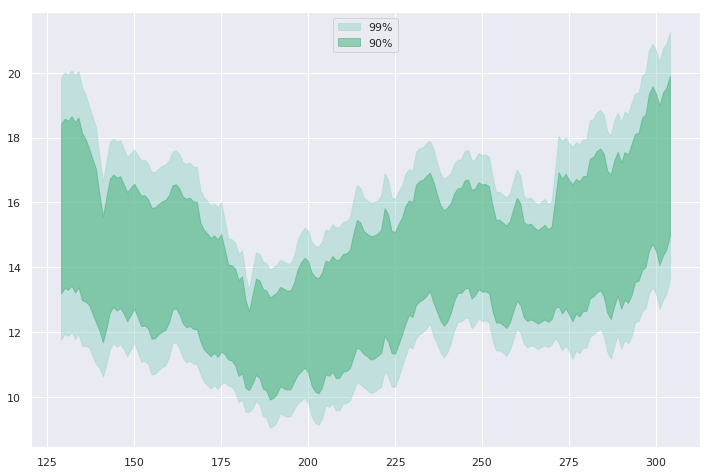
widths = [ '99%', '90%'] z_scores = [ 2.58, 1.67] colors = ['#99d8c9', '#41ae76'] for percent, Z, color in zip(widths, z_scores, colors): # バンドを識別できるよう色を設定 plt.fill_between( x=data.day, y1=data['mean'] - Z*data['std_err'], y2=data['mean'] + Z*data['std_err'] color=color,# 透過でグリッドを見せる alpha=0.5,# 凡例用にラベルを付与 label=percent)

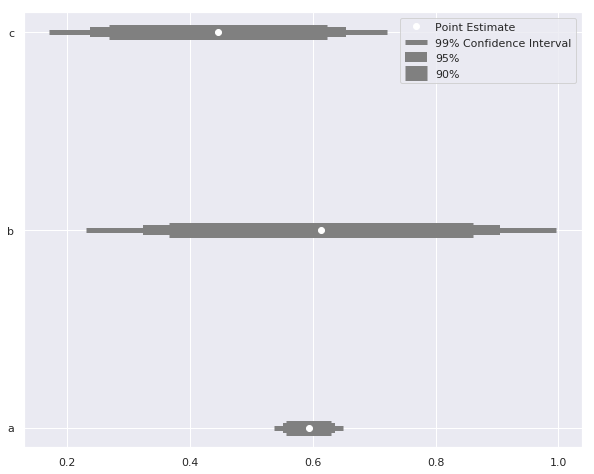
sizes = ['99% Confidence Interval', '95%', '90%'] # 区間ごとに線幅を変える widths = [ 5, 10, 15] Z_scores = [2.58, 1.96, 1.67] for size, z, width in zip(sizes, Z_scores, widths): plt.hlines( y = data.y, label = size, xmin = data['est'] - z*data['std_err'], xmax = data['est'] + z*data['std_err'], color = 'grey'# 区間に応じて線の太さを調整 linewidth = width)plt.plot('est', 'y', 'wo', data = data, label = 'Point Estimate') plt.legend()
Pythonでデータ可視化を磨く