点推定の区間
Pythonでデータ可視化を磨く

Nick Strayer
Instructor
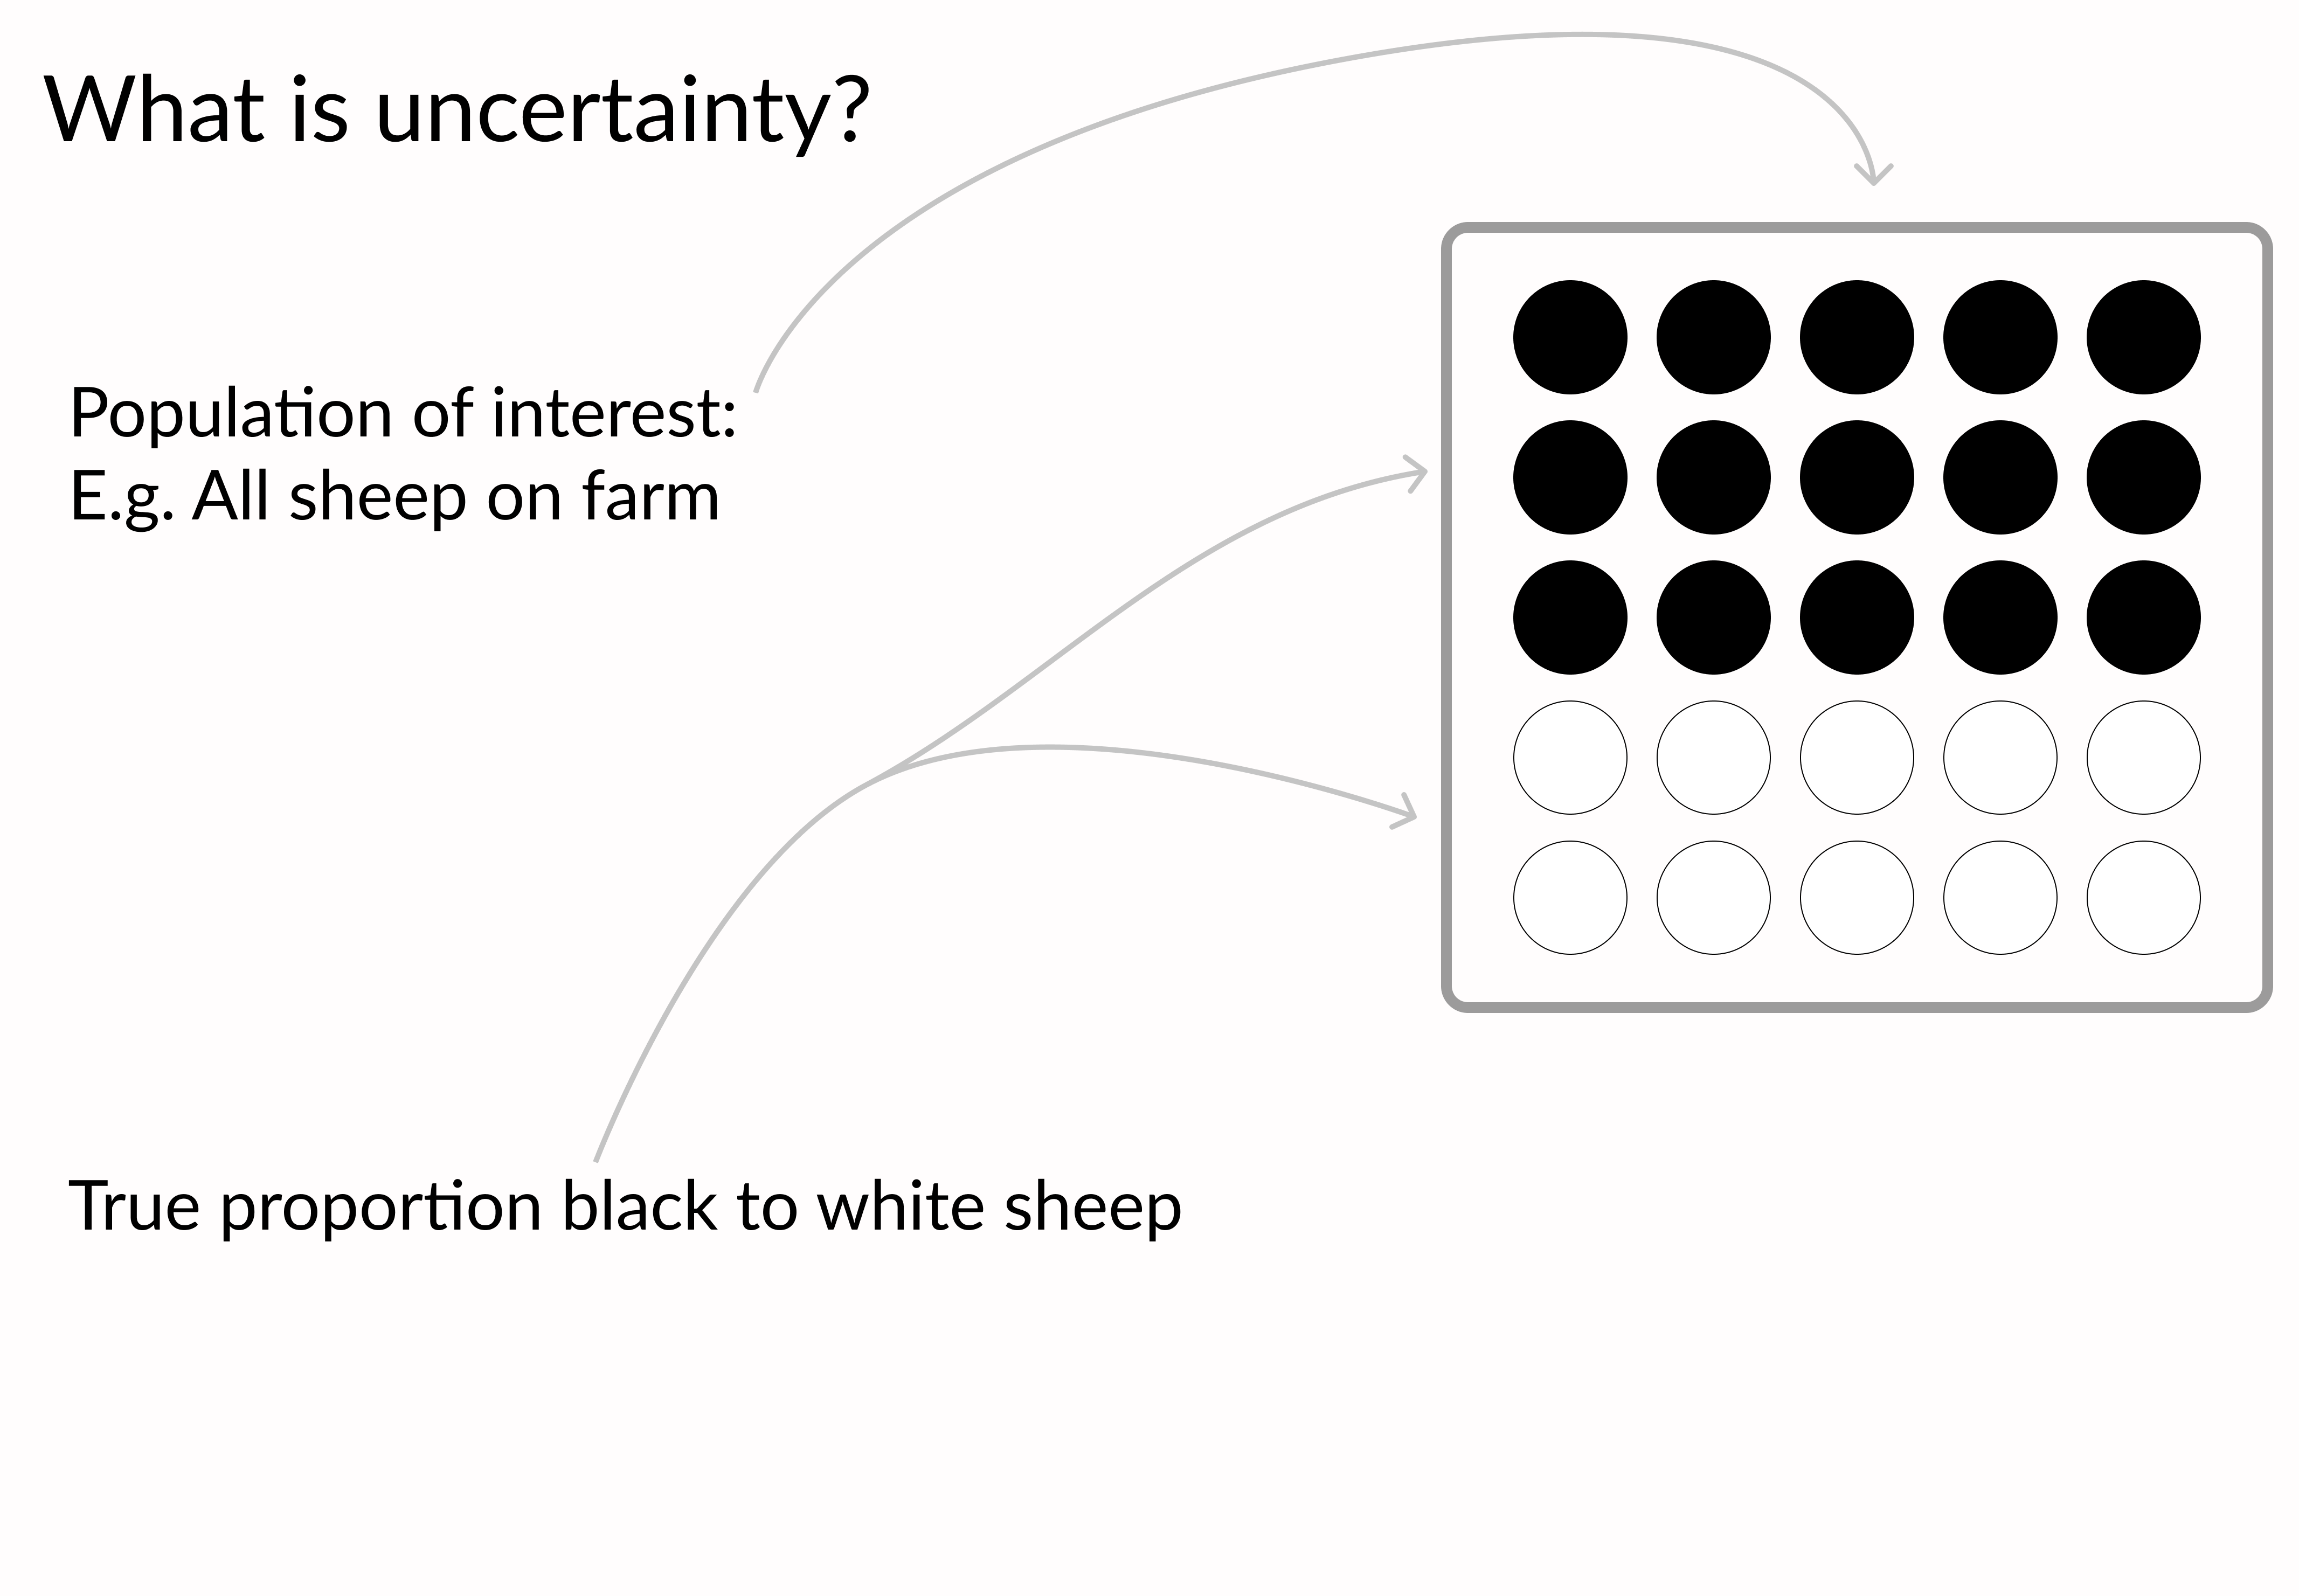
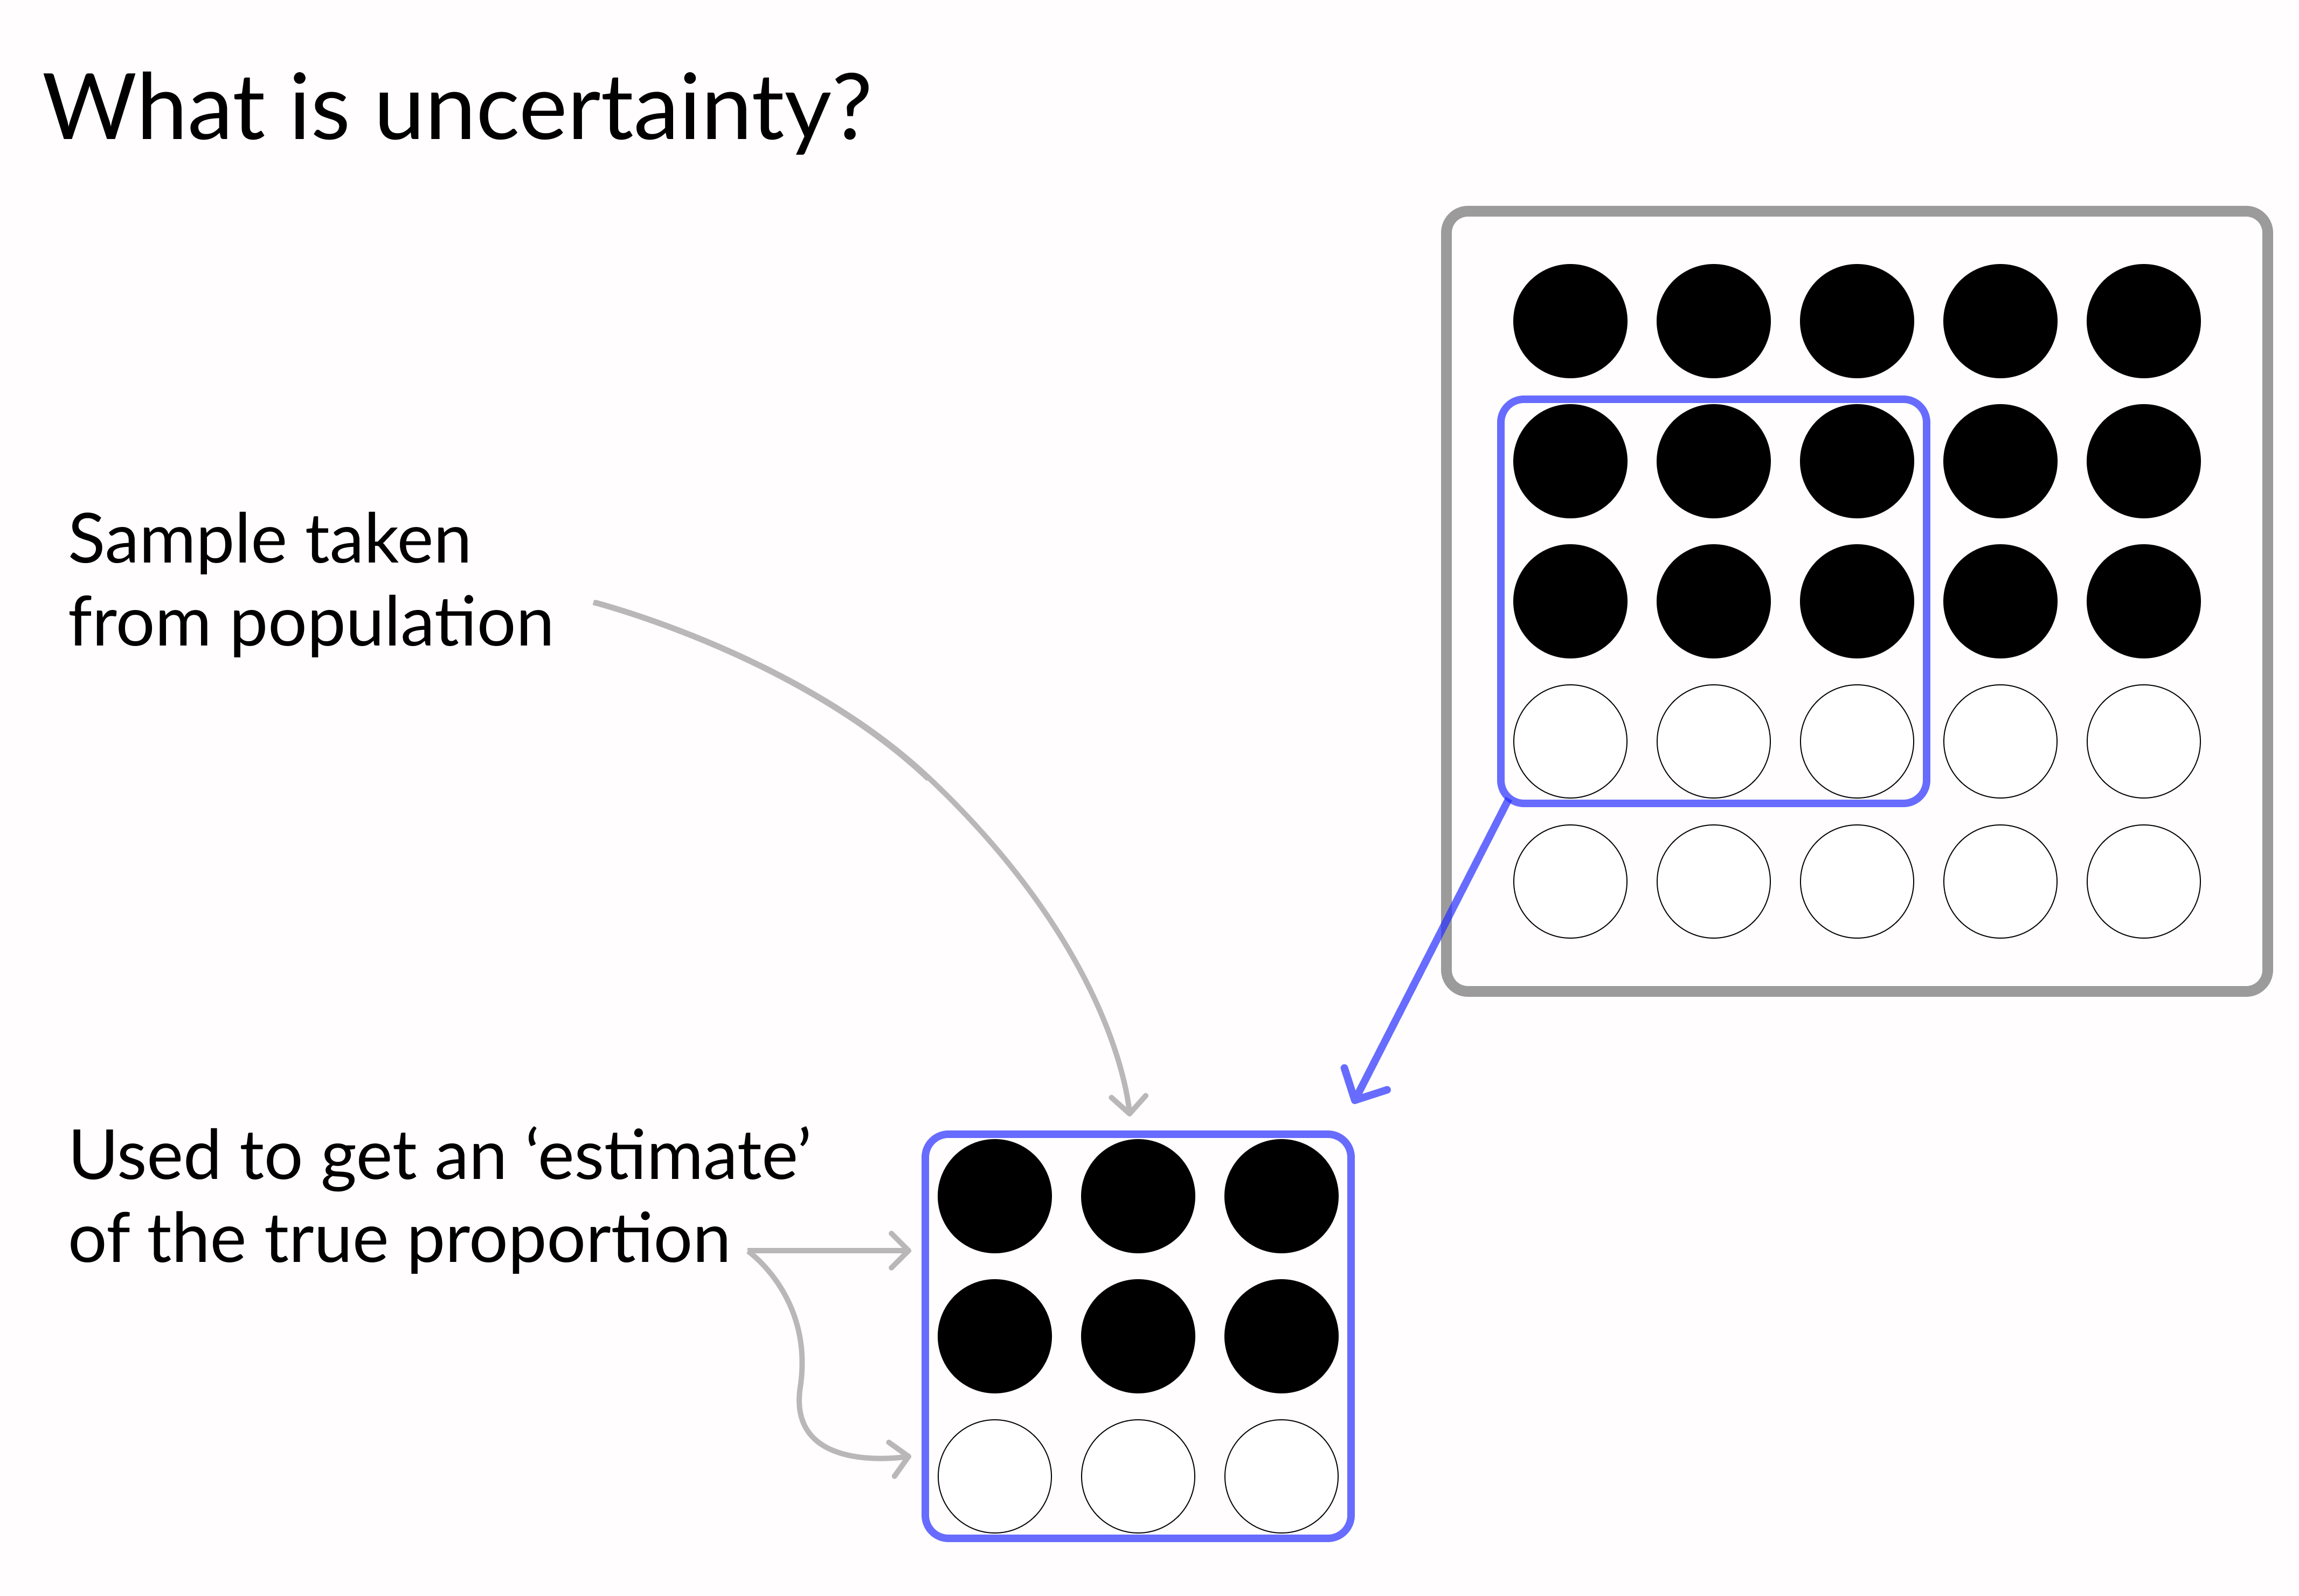
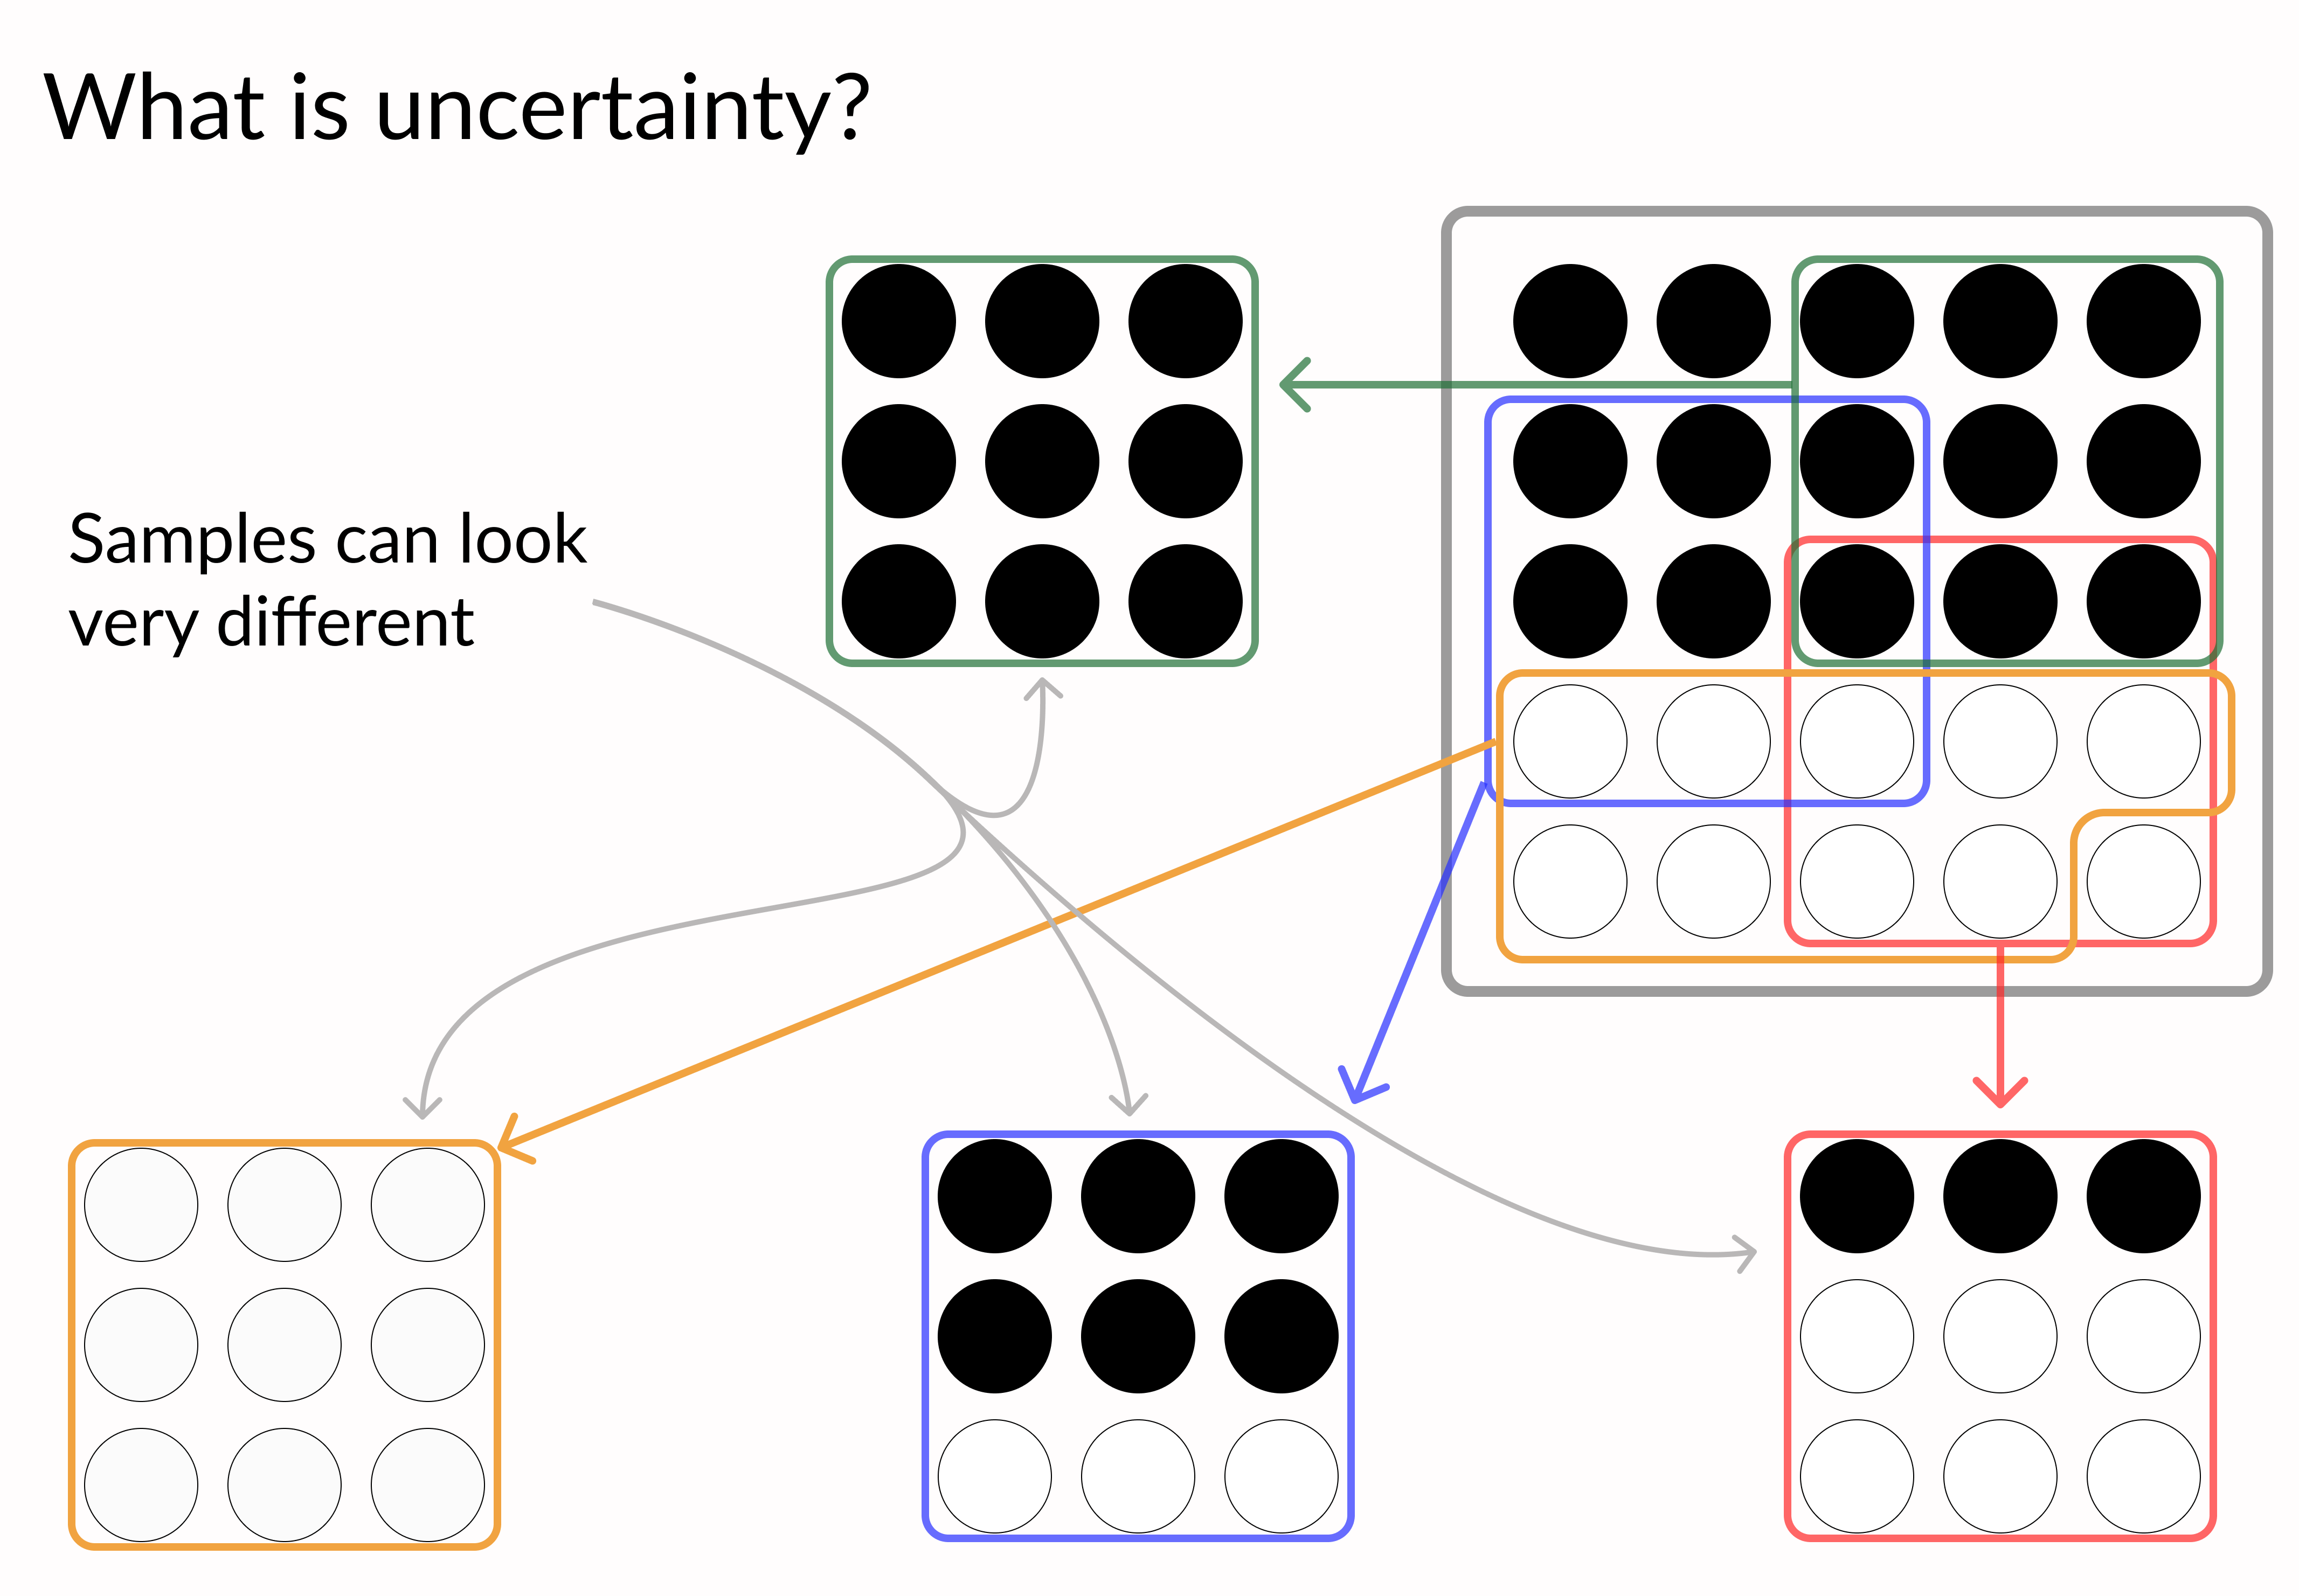
なぜ不確実性が重要か

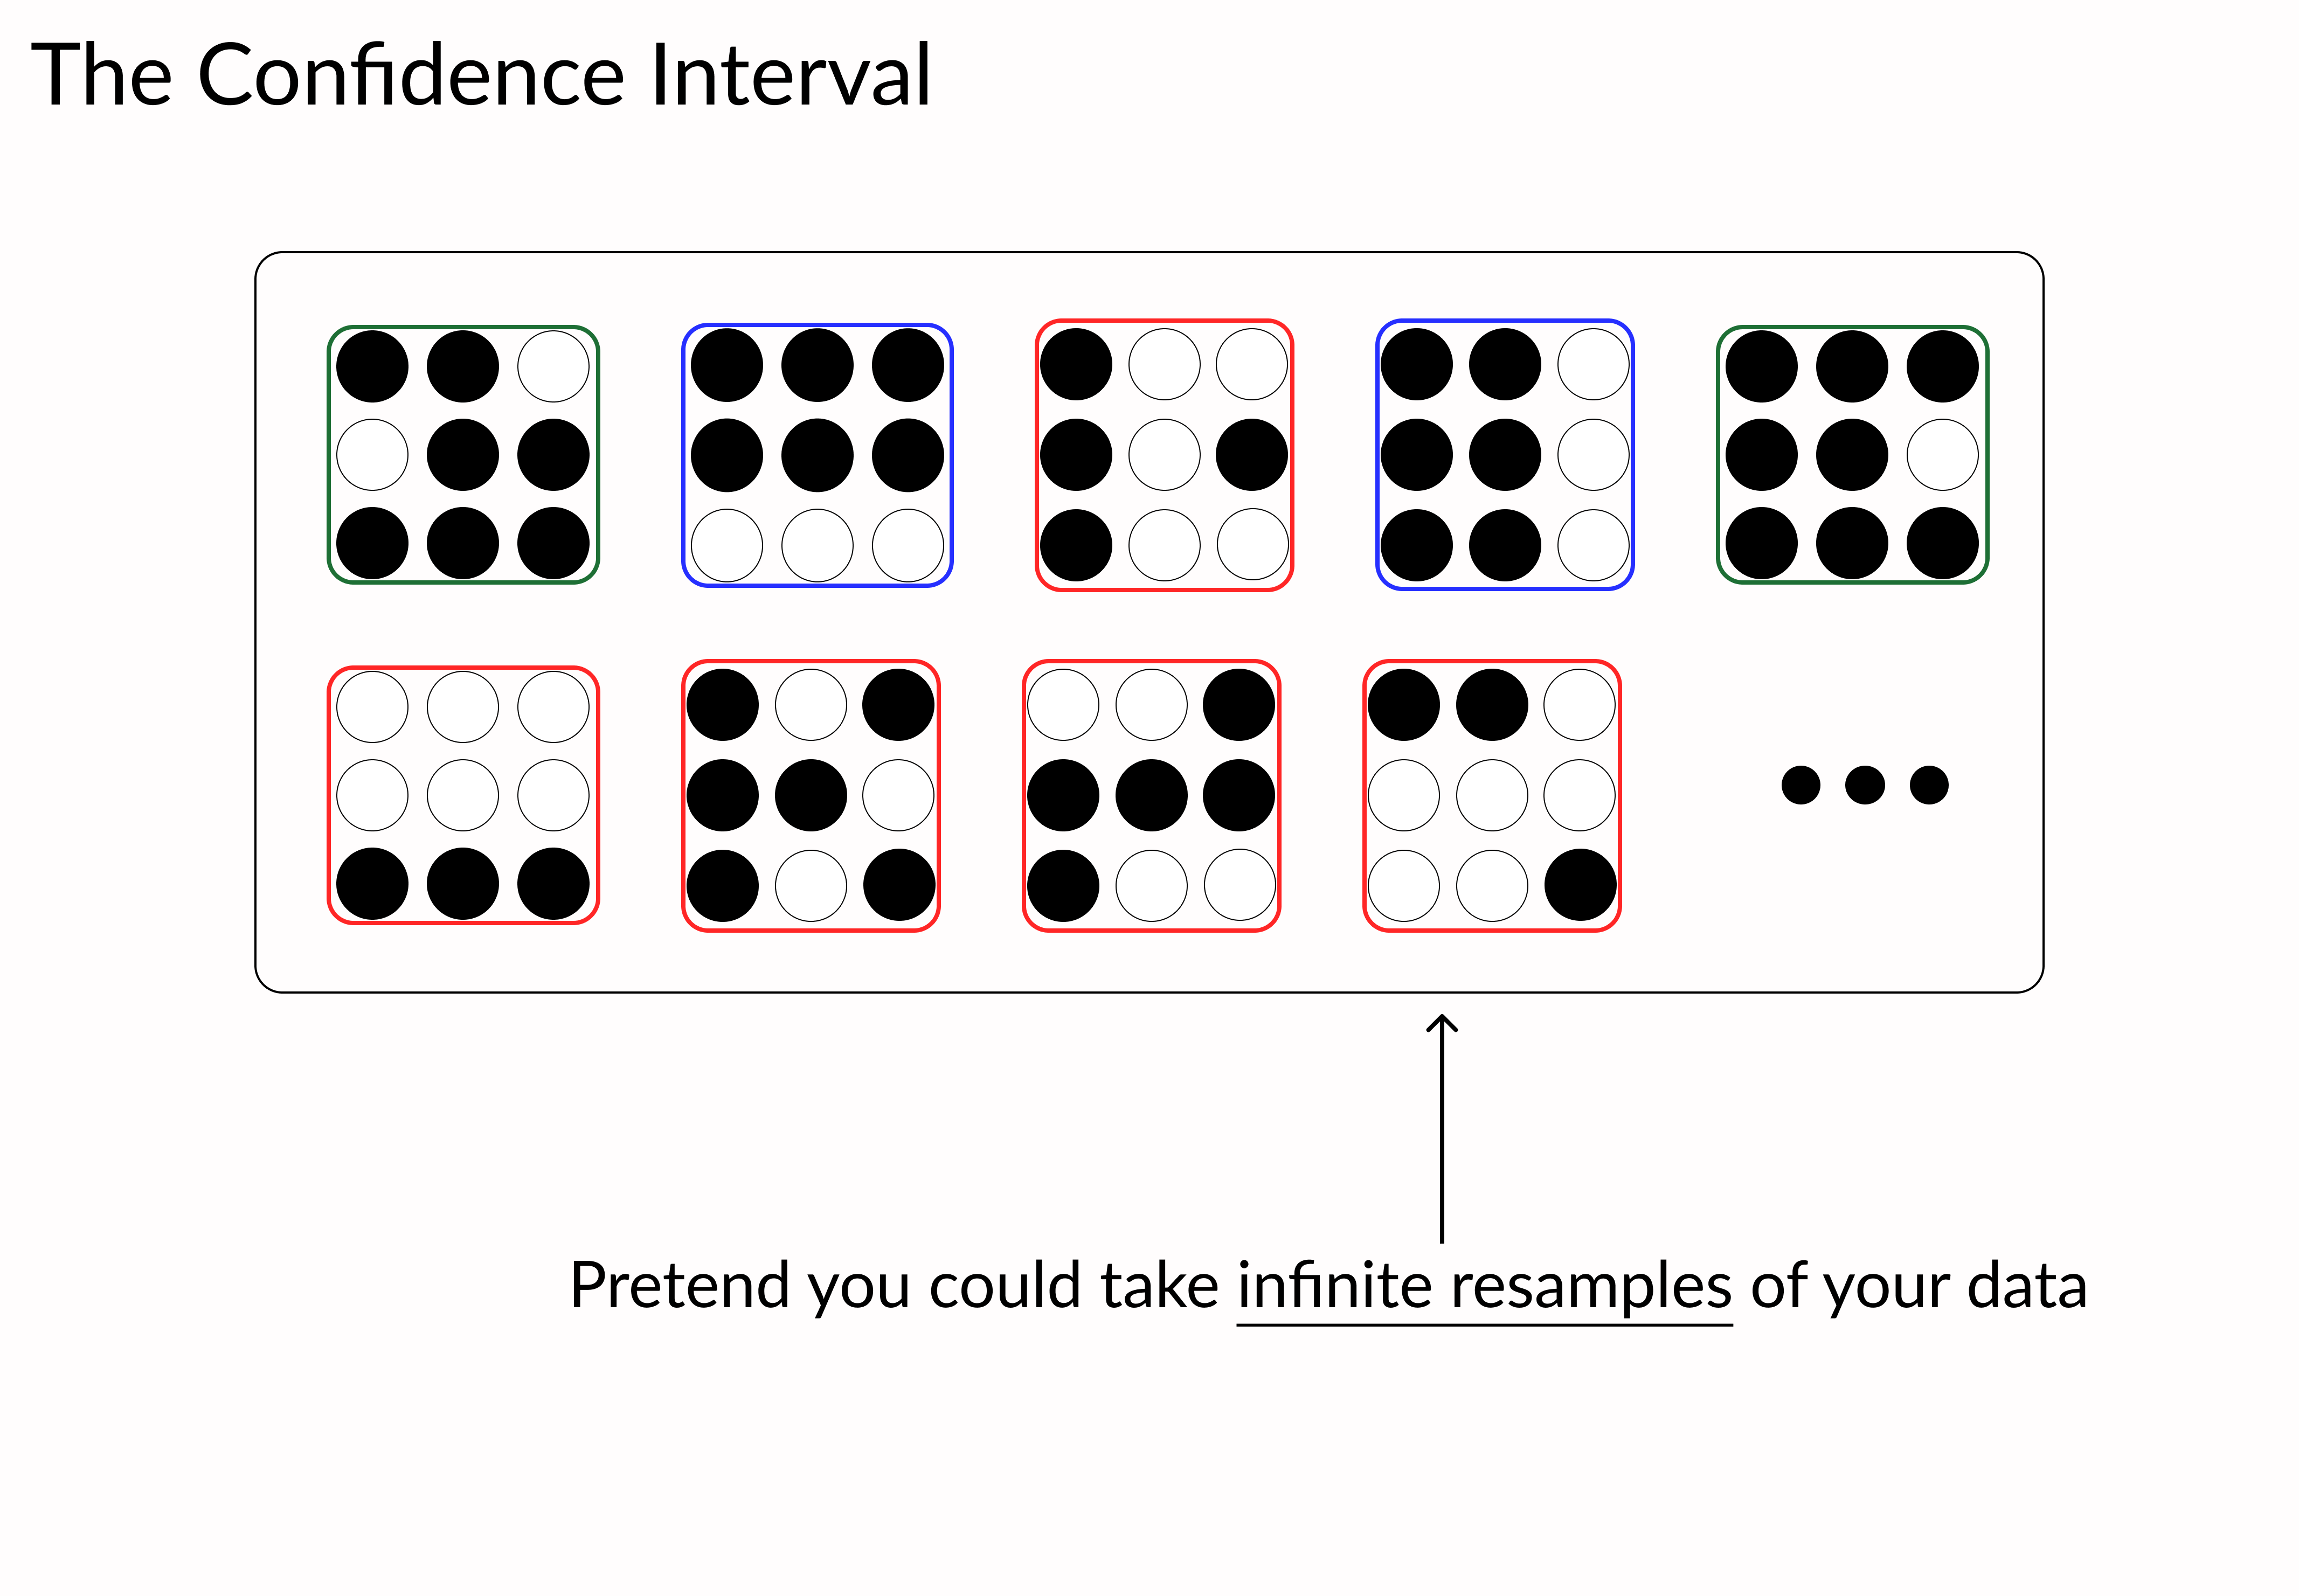
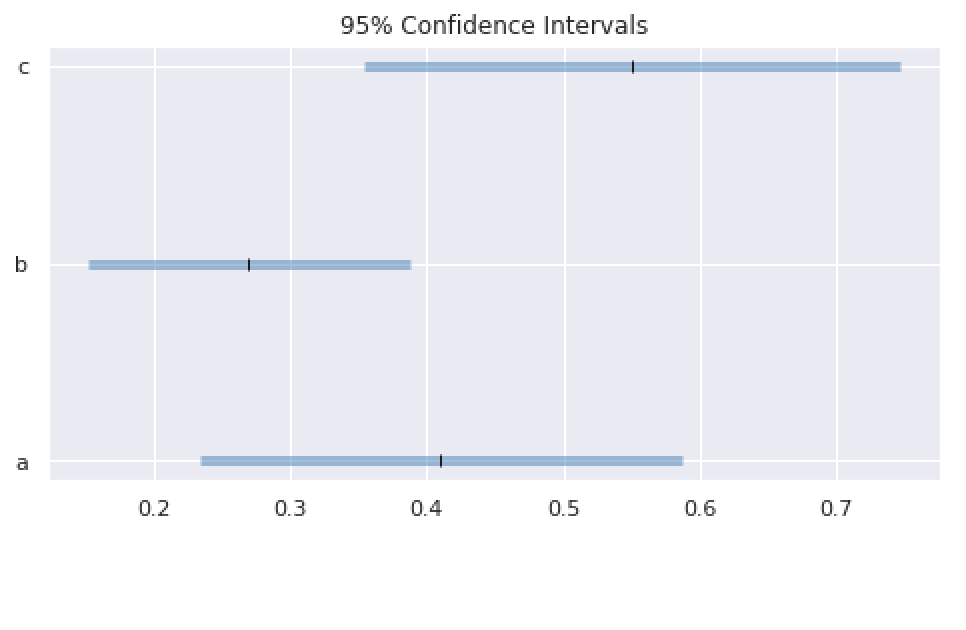
plt.hlines(xmin='lower', xmax='upper', y='y', data=data, linewidth=5, color='steelblue', alpha=0.5)# Point-estimate for reference plt.plot('est', 'y', 'k|', data = data)
Pythonでデータ可視化を磨く
Nick Strayer
Instructor
plt.hlines(xmin='lower', xmax='upper', y='y', data=data, linewidth=5, color='steelblue', alpha=0.5)# Point-estimate for reference plt.plot('est', 'y', 'k|', data = data)

