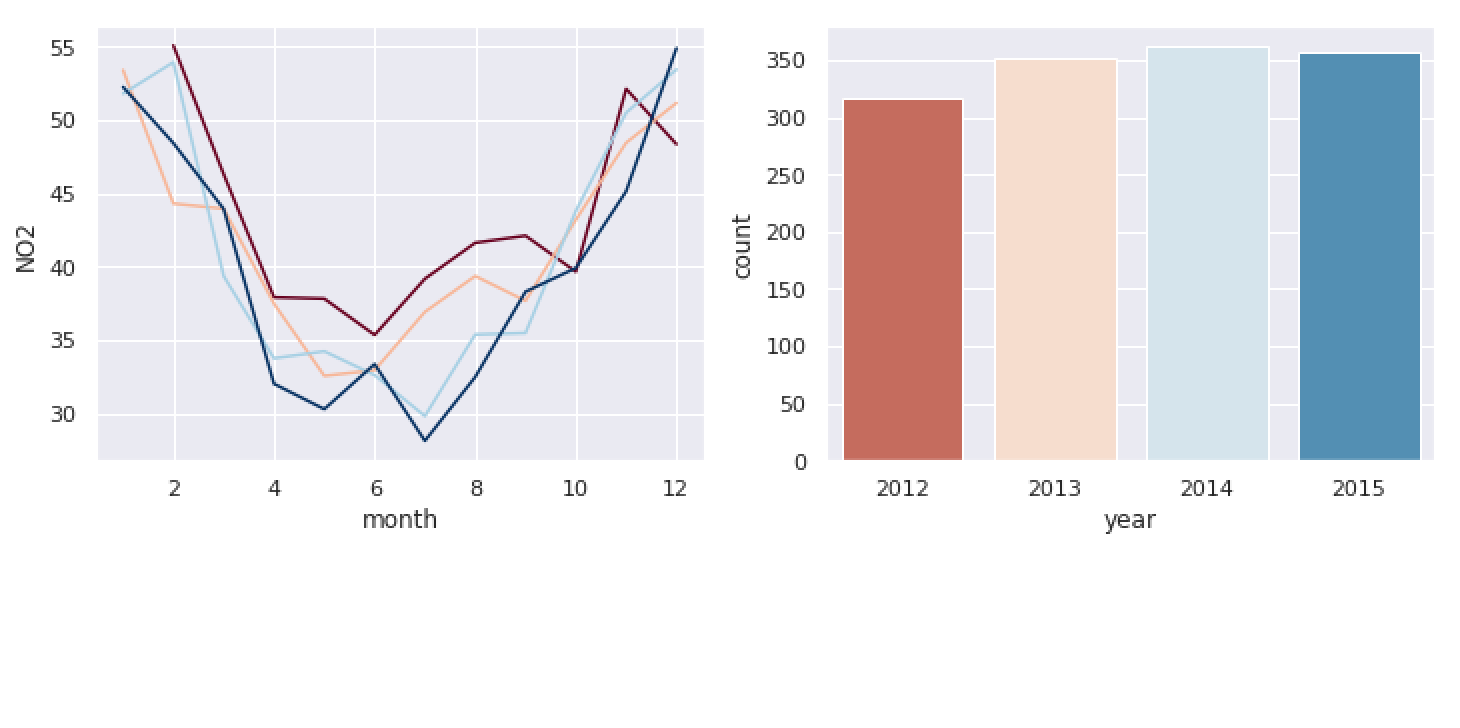
効率的な可視化を作る
Pythonでデータ可視化を磨く

Nick Strayer
Instructor
効率的とは?
- 物語が伝わるまでの負担を減らす
- 焦点がぶれないように再配置する
- 情報量に対する「インク」を改善する
- メッセージを損なわない

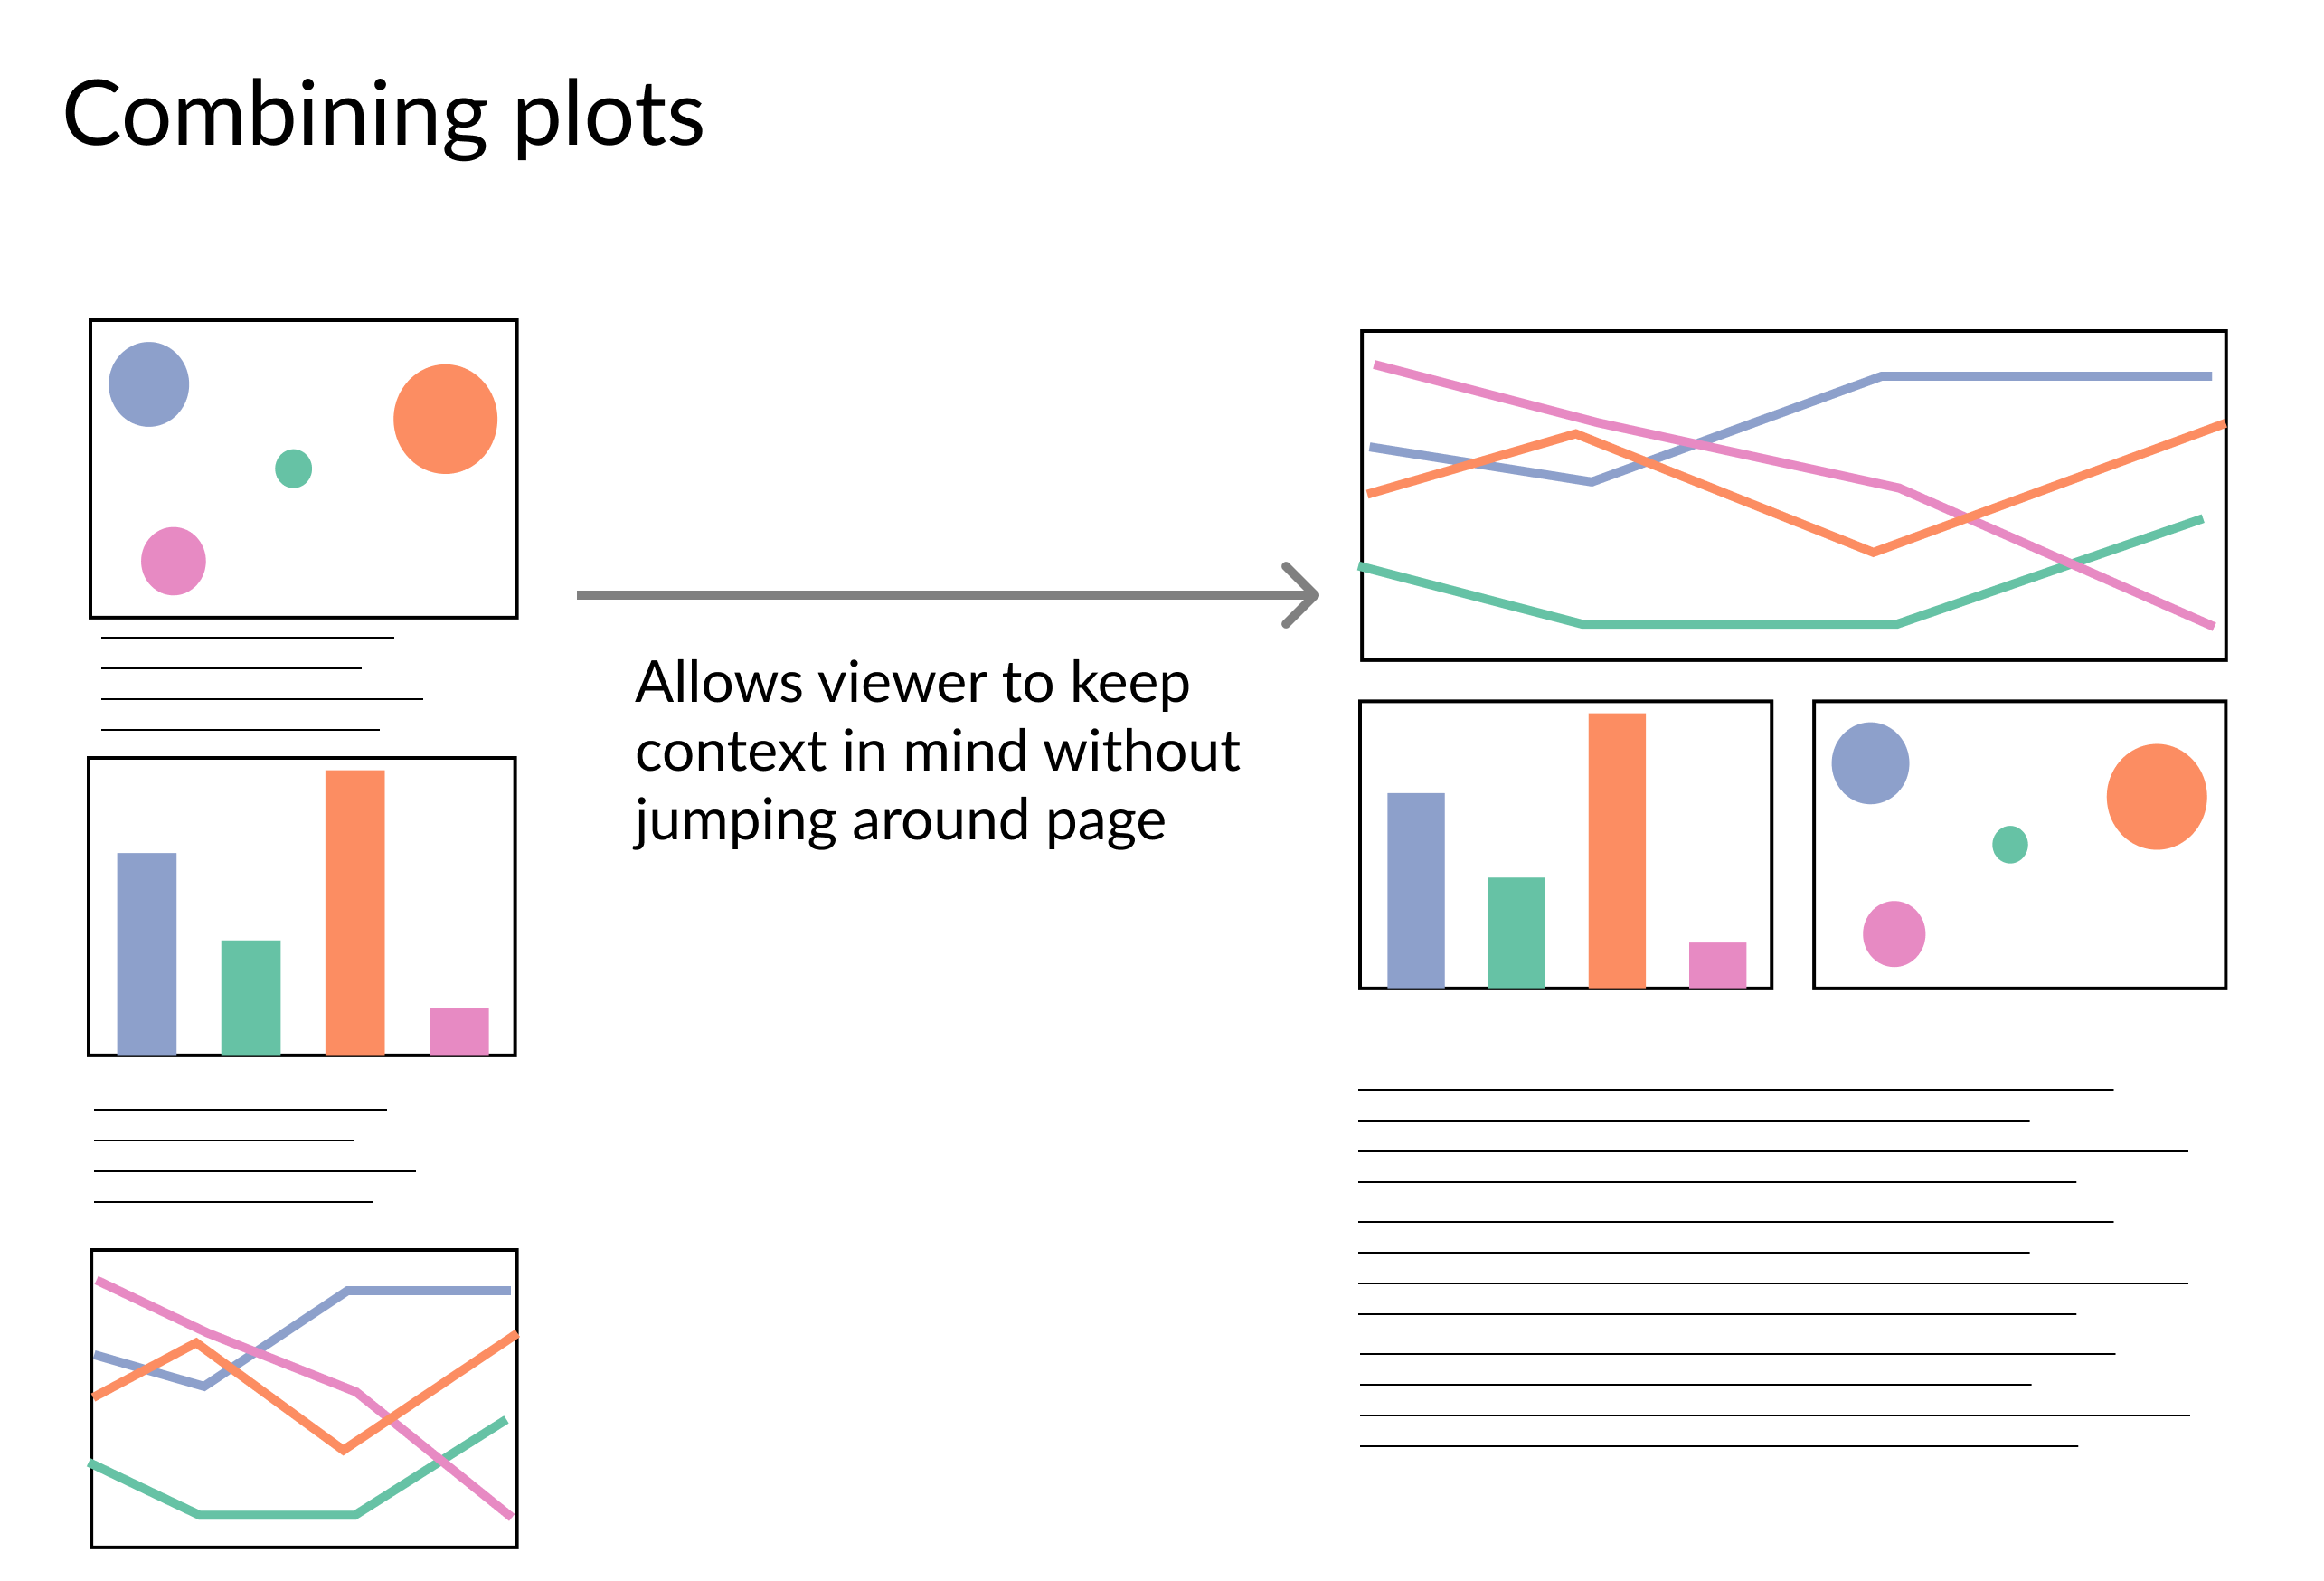
# Create a subplot w/ one row & two columns. f, (ax1, ax2) = plt.subplots(1, 2)# Pass each axes to respective plot sns.lineplot('month', 'NO2', 'year', ax=ax1, data=pol_by_month)sns.barplot('year', 'count', ax=ax2, data=obs_by_year)
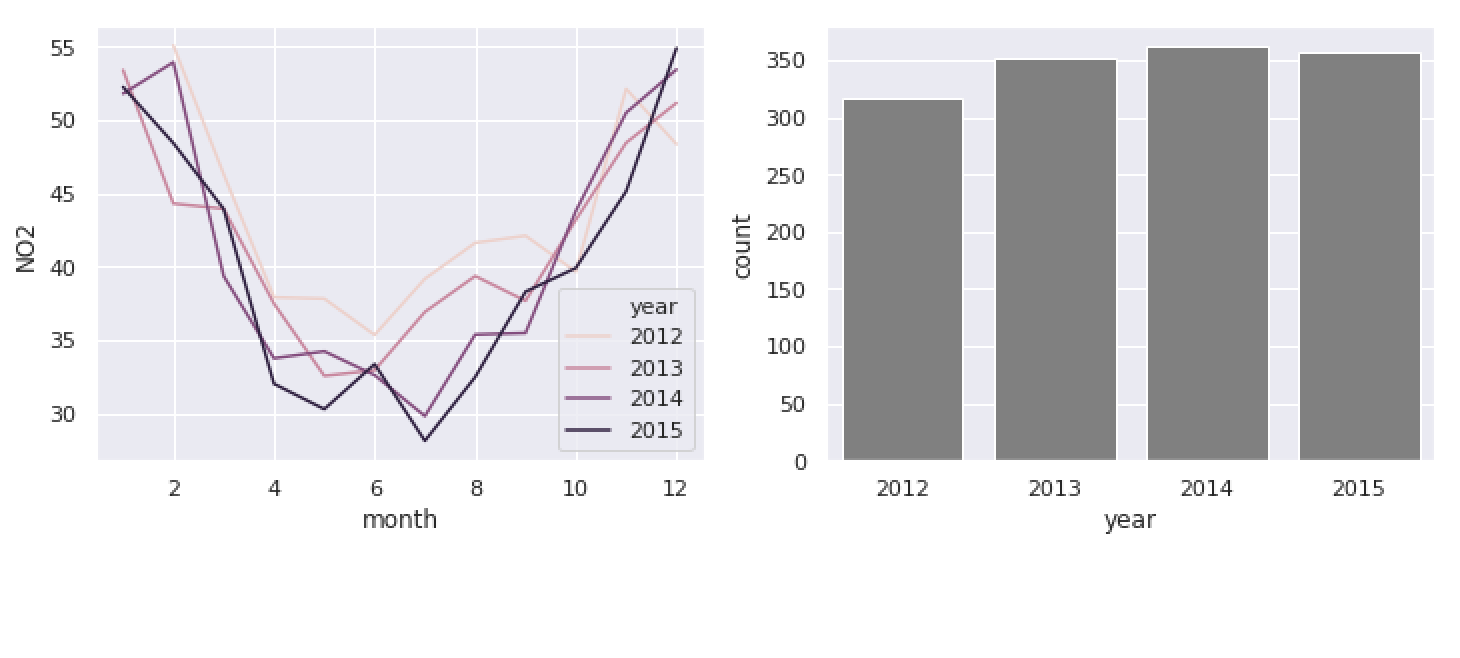
不要な凡例を削除
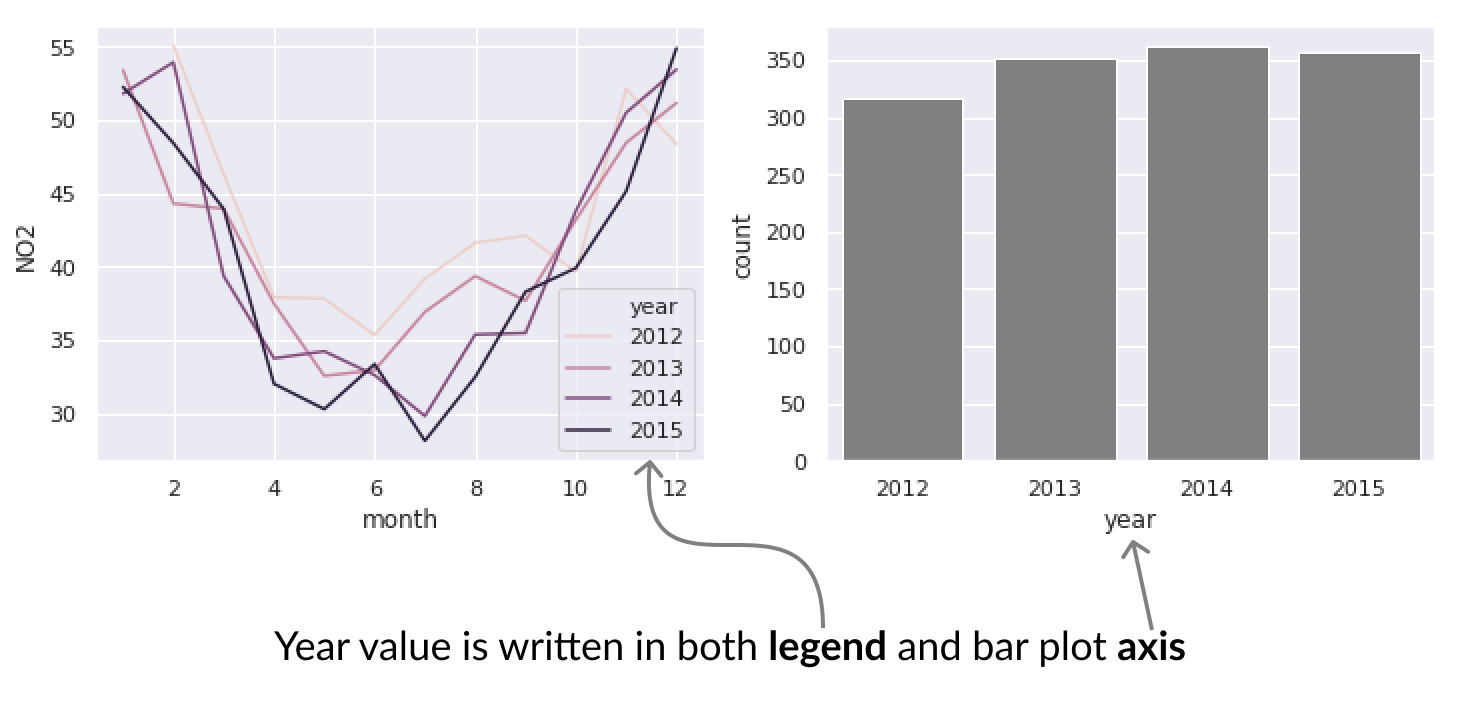
sns.lineplot('month', 'NO2', 'year', ax=ax1, data=pol_by_month, palette='RdBu',)sns.barplot('year', 'count', 'year', ax=ax2, data=obs_by_year, palette='RdBu', dodge=False)# Remove legends for both plots ax1.legend_.remove() ax2.legend_.remove()