クロスバリデーションで性能を推定する

R での tidymodels によるモデリング

David Svancer

Data Scientist

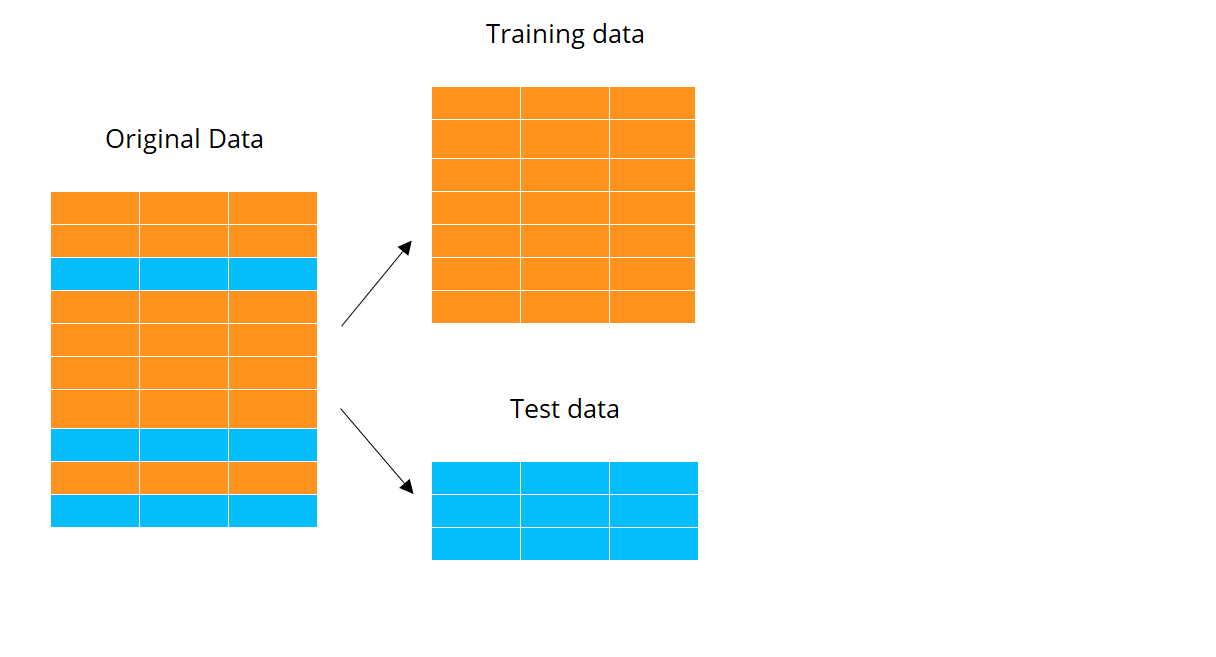
学習用データとテストデータ
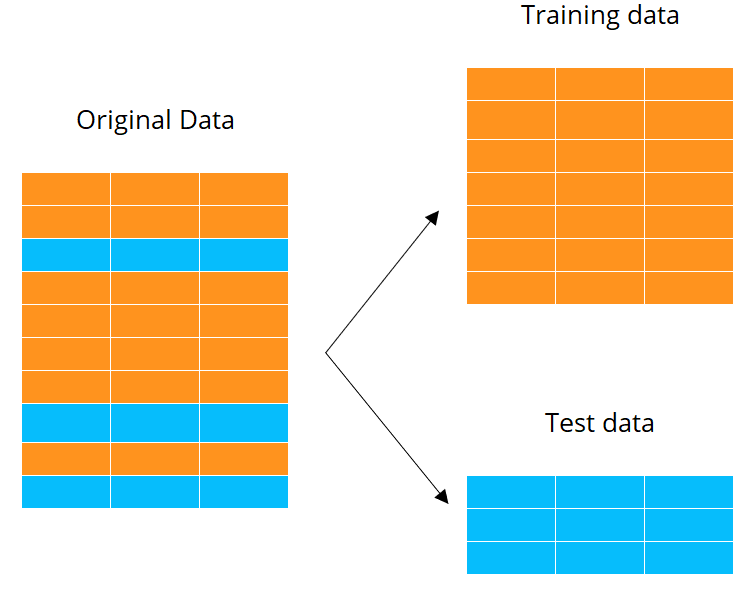
 

学習用データとテストデータの作成はモデリングの第一歩

  • 過学習を防ぐ
    • 学習データでモデルを当てはめる
    • テストデータでモデルを評価する


デメリット

  • モデル性能の推定は1回のみ


学習用とテスト用データの分割図

R での tidymodels によるモデリング

K 分割クロスバリデーション

モデル性能を探索するための再サンプリング手法

  • 学習過程でモデル性能の推定値を K 個提供


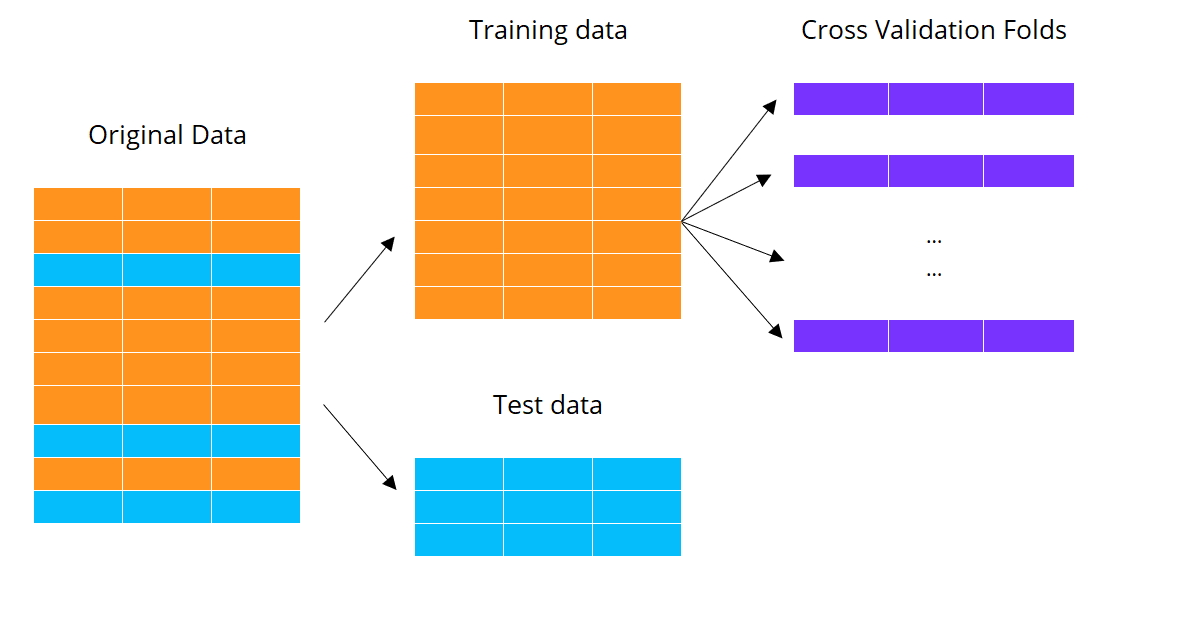
データを学習用とテスト用に分割

R での tidymodels によるモデリング

K 分割クロスバリデーション

モデル性能を探索するための再サンプリング手法

  • 学習過程でモデル性能の推定値を K 個提供
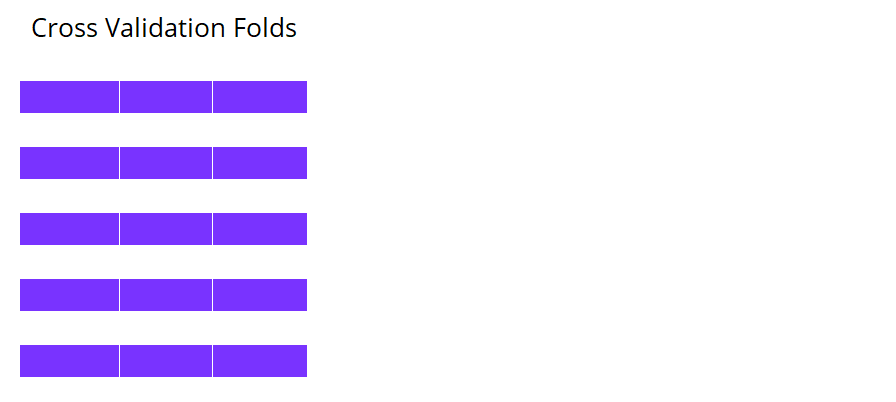
  • 学習データをほぼ等サイズの K 個にランダム分割
  • フォールドを用いて K 回の学習と評価を実施


学習データをクロスバリデーション用フォールドに分割

R での tidymodels によるモデリング

クロスバリデーションによる機械学習

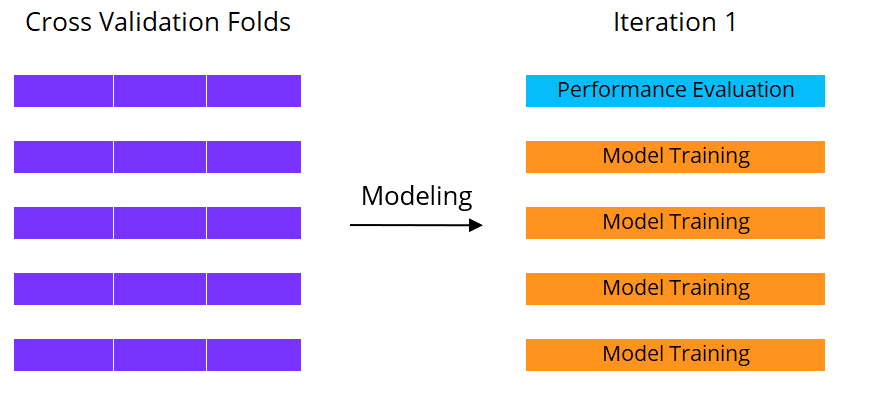
5分割クロスバリデーションの実施

  • 学習と評価を5回反復


5分割クロスバリデーションの1回目

R での tidymodels によるモデリング

クロスバリデーションによる機械学習

5分割クロスバリデーションの実施

  • 学習と評価を5回反復
  • 反復1
    • フォールド1を評価用、フォールド2〜5を学習用に使用


5分割クロスバリデーションの1回目

R での tidymodels によるモデリング

クロスバリデーションによる機械学習

5分割クロスバリデーションの実施

  • 学習と評価を5回反復
  • 反復1
    • フォールド1を評価用、フォールド2〜5を学習用に使用
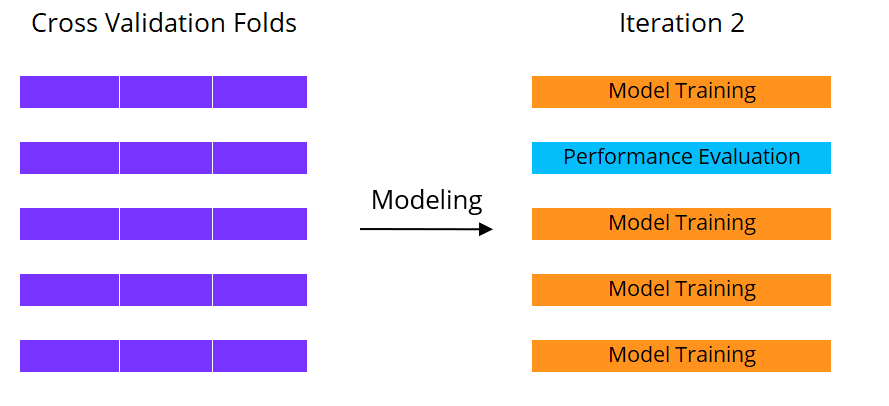
  • 反復2
    • フォールド2を評価用に使用


5分割クロスバリデーションの2回目

R での tidymodels によるモデリング

クロスバリデーションによる機械学習

5分割クロスバリデーションの実施

  • 学習と評価を5回反復
  • 反復1
    • フォールド1を評価用、フォールド2〜5を学習用に使用
  • 反復2
    • フォールド2を評価用に使用


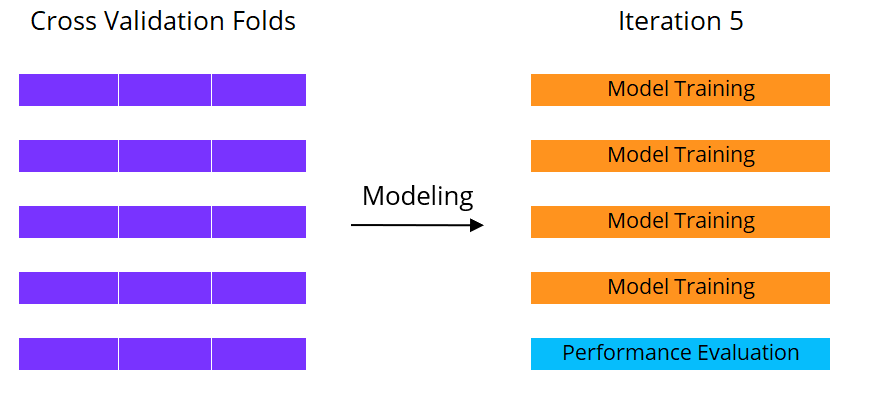
合計でモデル性能の推定値は5つ


5分割クロスバリデーションの5回目

R での tidymodels によるモデリング

クロスバリデーション用フォールドの作成

vfold_cv() 関数

  • 学習データ
  • フォールド数 v
  • 層化変数 strata
  • 再現性のために vfold_cv() の前に set.seed() を実行
  • splits
    • フォールド作成用のデータ分割オブジェクトが入るリスト列
set.seed(214)
leads_folds <- vfold_cv(leads_training,

v = 10,
strata = purchased)
leads_folds
#  10-fold cross-validation using stratification 
# A tibble: 10 x 2
   splits            id    
   <list>            <chr> 
 1 <split [896/100]> Fold01
 2 <split [896/100]> Fold02
 3 <split [896/100]> Fold03
 . ................  ......
 9 <split [897/99]>  Fold09
10 <split [897/99]>  Fold10
R での tidymodels によるモデリング

クロスバリデーションでモデル学習

fit_resamples() 関数

  • parsnip モデルまたは workflow オブジェクトを学習
  • クロスバリデーションのフォールドを resamples に指定
  • 任意のカスタム指標関数 metrics
    • 既定は Accuracy と ROC AUC


各指標は10回推定される

  • フォールドごとに1つの推定値
  • 平均は mean
leads_rs_fit <- leads_wkfl %>%

fit_resamples(resamples = leads_folds,
metrics = leads_metrics)
leads_rs_fit %>% collect_metrics()
# A tibble: 3 x 5
  .metric .estimator  mean     n std_err
  <chr>   <chr>      <dbl> <int>   <dbl>
1 roc_auc binary     0.823    10  0.0147
2 sens    binary     0.786    10  0.0203
3 spec    binary     0.855    10  0.0159
R での tidymodels によるモデリング

クロスバリデーション結果の詳細

collect_metrics() 関数

  • summarize = FALSE で各フォールドの全推定値を取得
  • 合計30件(3指標 × 10フォールド)
    • .metric 列は指標名
    • .estimate 列は各フォールドの推定値
rs_metrics <- leads_rs_fit %>% 
  collect_metrics(summarize = FALSE)

rs_metrics
# A tibble: 30 x 4
   id     .metric .estimator .estimate
   <chr>  <chr>   <chr>          <dbl>
 1 Fold01 sens    binary         0.861
 2 Fold01 spec    binary         0.891
 3 Fold01 roc_auc binary         0.885
 4 Fold02 sens    binary         0.778
 5 Fold02 spec    binary         0.969
 6 Fold02 roc_auc binary         0.885
# ... with 24 more rows
R での tidymodels によるモデリング

クロスバリデーション結果の要約

collect_metrics() は tibble を返す

  • 結果は dplyr で要約可能
    • まず rs_metrics を使用
    • .metric ごとにグループ化
    • summarize() で要約統計量を算出
rs_metrics %>%

group_by(.metric) %>%
summarize(min = min(.estimate), median = median(.estimate), max = max(.estimate), mean = mean(.estimate), sd = sd(.estimate))
# A tibble: 3 x 6
 .metric   min  median   max   mean     sd
  <chr>   <dbl>  <dbl>  <dbl>  <dbl>   <dbl>
1 roc_auc 0.758  0.806  0.885  0.823   0.0466
2 sens    0.667  0.792  0.861  0.786   0.0642
3 spec    0.810  0.843  0.969  0.855   0.0502
R での tidymodels によるモデリング

クロスバリデーションの考え方

fit_resamples() で学習したモデルは、新しいデータに予測を返しません

  • predict() は resample オブジェクトを受け付けない

fit_resample() の目的

  • モデル種別ごとの性能プロファイルを比較・探索する
  • 最良のモデル種別を選び、学習に注力する
predict(leads_rs_fit,
        new_data = leads_test)

Error in UseMethod("predict") : 
  no applicable method for 'predict' applied to 
  an object of class 
  "c('resample_results', 
      'tune_results',  
      'tbl_df', 
      'tbl', 'data.frame')"
R での tidymodels によるモデリング

クロスバリデーションをやってみましょう!

R での tidymodels によるモデリング

Preparing Video For Download...