ハイパーパラメータのチューニング
R での tidymodels によるモデリング

David Svancer
Data Scientist
ハイパーパラメータ
学習前に設定し、モデルの複雑さを制御するパラメータ
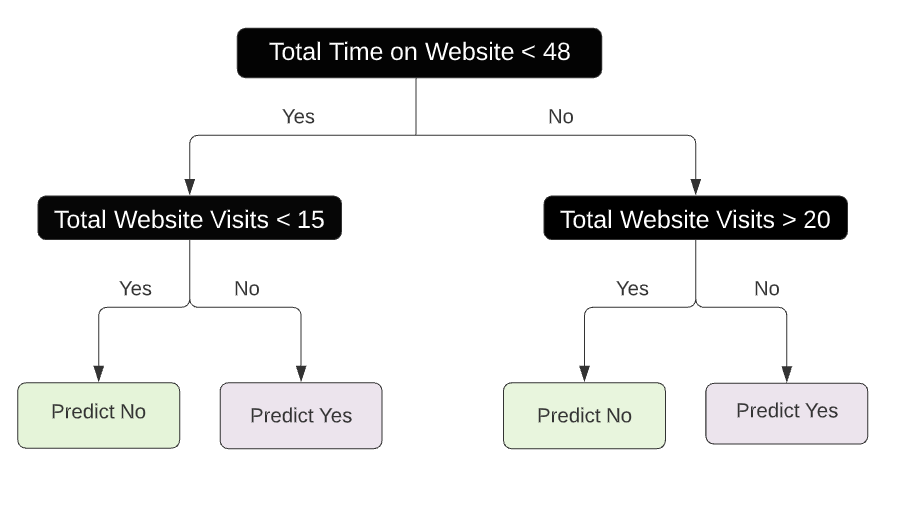
parsnip の決定木
cost_complexity- 終端ノード数が多いほど罰則
tree_depth- ルートから終端までの最長パス
min_n- さらに分割するために必要な最小データ数
既定のハイパーパラメータ値
decision_tree() は既定のハイパーパラメータを設定します
cost_complexityは 0.01tree_depthは 30min_nは 20
これらが常に最適とは限りません
- ハイパーパラメータのチューニング
- 交差検証で最適なハイパーパラメータ集合を探す手順
dt_model <- decision_tree() %>%
  set_engine('rpart') %>%
  set_mode('classification')
チューニング対象のラベル付け
tune パッケージの tune() 関数
- チューニング対象のハイパーパラメータは、
parsnipのモデル指定でtune()を設定 - チューニング可能なパラメータを持つモデルオブジェクトを作成
- 他の関数に最適化が必要であることを伝える
dt_tune_model <- decision_tree(cost_complexity = tune(), tree_depth = tune(), min_n = tune()) %>% set_engine('rpart') %>% set_mode('classification')dt_tune_model
Decision Tree Model Specification (classification)

Main Arguments:
  cost_complexity = tune()
  tree_depth = tune()
  min_n = tune()

Computational engine: rpart
チューニング用ワークフローの作成
workflow オブジェクトは簡単に更新できます
- 既存の
leads_wkfl- リードスコア用の特徴量作成と、デフォルト値の決定木モデル
leads_wkflをupdate_model()に渡し、チューニング対象の決定木モデルを指定
leads_tune_wkfl <- leads_wkfl %>%update_model(dt_tune_model)leads_tune_wkfl
== Workflow ===============
Preprocessor: Recipe
Model: decision_tree()
-- Preprocessor -----------
3 Recipe Steps
* step_corr()
* step_normalize()
* step_dummy()
-- Model ------------------
Decision Tree Model Specification (classification)
Main Arguments: cost_complexity = tune()
                tree_depth = tune()
                min_n = tune()
Computational engine: rpart
グリッドサーチ
ハイパーパラメータを調整する一般的な方法
- ハイパーパラメータ値の一意な組合せグリッドを作成
- 各組合せで交差検証し性能を推定
- 最良の組合せを選択
| cost_complexity | tree_depth | min_n |
|---|---|---|
| 0.001 | 20 | 35 |
| 0.001 | 20 | 15 |
| 0.001 | 35 | 35 |
| 0.001 | 35 | 15 |
| 0.2 | 20 | 35 |
| ... | ... | ... |
ハイパーパラメータの特定
dials パッケージの parameters() 関数
parsnipのモデルオブジェクトを受け取るtune()でラベル付けされたハイパーパラメータを tibble で返すdialsでチューニンググリッドを作成する際に使用
parameters(dt_tune_model)
Collection of 3 parameters for tuning

  identifier            type     object
cost_complexity  cost_complexity nparam[+]
tree_depth       tree_depth      nparam[+]
min_n            min_n           nparam[+]
ランダムグリッド
ランダムな組合せの生成
- この方法は最適値に到達しやすい傾向があります
grid_random() 関数
- 第1引数は
parameters()の結果 sizeは生成するランダム組合せ数- 再現性のため
grid_random()の前にset.seed()を実行
- 再現性のため
set.seed(214) grid_random(parameters(dt_tune_model),size = 5)
# A tibble: 5 x 3
  cost_complexity  tree_depth min_n
            <dbl>      <int>  <int>
1    0.0000000758        14     39
2    0.0243               5     34
3    0.00000443          11      8
4    0.000000600          3      5
5    0.00380              5     36
チューニンググリッドの保存
チューニングの最初の手順
- チューニンググリッドを作成して保存
dt_gridにはハイパーパラメータのランダムな5組が含まれます
set.seed(214) dt_grid <- grid_random(parameters(dt_tune_model), size = 5)dt_grid
# A tibble: 5 x 3
  cost_complexity  tree_depth min_n
            <dbl>      <int>  <int>
1    0.0000000758        14     39
2    0.0243               5     34
3    0.00000443          11      8
4    0.000000600          3      5
5    0.00380              5     36
交差検証によるハイパーパラメータのチューニング
tune_grid() はハイパーパラメータのチューニングを実行します
主な引数
workflowまたはparsnipモデル- 交差検証オブジェクト
resamples - チューニンググリッド
grid - 任意の
metrics関数
返り値は結果の tibble
.metrics- 各フォールドの結果を持つリスト列
dt_tuning <- leads_tune_wkfl %>%tune_grid(resamples = leads_folds,grid = dt_grid,metrics = leads_metrics)
dt_tuning
# Tuning results
# 10-fold cross-validation using stratification
# A tibble: 10 x 4
   splits             id       .metrics         ..
   <list>            <chr>      <list>          ..
<split [896/100]>   Fold01   <tibble [15 x 7]>  ..
................    ......   ...............    ..
<split [897/99]>    Fold09   <tibble [15 x 7]>  ..
<split [897/99]>    Fold10   <tibble [15 x 7]>  ..
チューニング結果の確認
collect_metrics() は既定で要約結果を返します
- 各組合せについて全フォールド平均の指標値を表示
dt_tuning %>%
  collect_metrics()
# A tibble: 15 x 9
   cost_complexity tree_depth min_n .metric .estimator  mean     n std_err .config
             <dbl>      <int> <int> <chr>   <chr>      <dbl> <int>   <dbl> <chr>
 1    0.0000000758         14    39 roc_auc binary     0.827    10 0.0147  Model1
 2    0.0000000758         14    39 sens    binary     0.728    10 0.0277  Model1
 3    0.0000000758         14    39 spec    binary     0.865    10 0.0156  Model1
 4    0.0243                5    34 roc_auc binary     0.823    10 0.0147  Model2
 .    ......               ..    .. ....    ......     .....    .. .....   ......
14    0.00380               5    36 sens    binary     0.747    10 0.0209  Model5
15    0.00380               5    36 spec    binary     0.858    10 0.0161  Model5
さあ、チューニングしましょう!
R での tidymodels によるモデリング

