モデル適合度の評価
R での tidymodels によるモデリング

David Svancer
Data Scientist
2値分類
2値の目的変数
- 【陽性クラス】
- 予測したい事象
purchasedでは "yes"
【陰性クラス】
- "no"
tidymodelsでは目的変数は factor 必須- 第1レベルが陽性クラス
- 順序は
levels()で確認
leads_df
# A tibble: 1,328 x 7
  purchased total_visits  ...   us_location
   <fct>        <dbl>     ...     <fct>
 1 yes            7       ...     west
 2 no             8       ...     west
 3 no             5       ...     southeast
# ... with 1,325 more rows
levels(leads_df[['purchased']])
[1] "yes" "no"
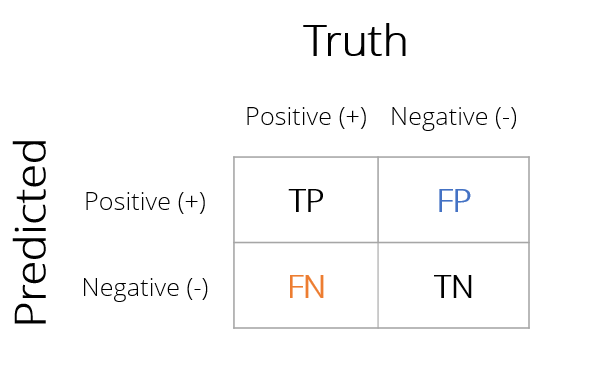
混同行列
実際値と予測値の全組合せの件数を示す行列
【正解】
- 真陽性(TP)
- 真陰性(TN)
【誤分類】
- 偽陽性(FP)
- 偽陰性(FN)
yardstick による分類指標
yardstick で混同行列や適合度指標を作成
- 必要なモデル結果の tibble には次を含む:
- 真のラベル
purchased
- 予測クラス
.pred_class
- 各クラスの推定確率
.pred_yes.pred_no
- 真のラベル
leads_results
# A tibble: 332 x 4
   purchased .pred_class .pred_yes .pred_no
   <fct>     <fct>           <dbl>    <dbl>
 1 no        no             0.134     0.866
 2 yes       yes            0.729     0.271
 3 no        no             0.133     0.867
 4 no        no             0.0916    0.908
 5 yes       yes            0.598     0.402
 6 no        no             0.128     0.872
 7 yes       no             0.112     0.888
 8 no        no             0.169     0.831
 9 no        no             0.158     0.842
10 yes       yes            0.520     0.480
# ... with 322 more rows
yardstick の混同行列
conf_mat() 関数
- モデル結果の tibble
truth- 真のラベル列estimate- 予測ラベル列
leads_df のロジスティック回帰
- 332名中252名を正しく分類(76%)
- 偽陰性 46
- 偽陽性 34
conf_mat(leads_results,truth = purchased,estimate = .pred_class)
Truth
Prediction yes no
yes 74 34
no 46 178
分類精度(Accuracy)
accuracy() 関数
conf_mat()と同じ引数を取る- 分類精度を計算
$$\frac{TP + TN}{TP + TN + FP + FN}$$
yardstick関数は常に tibble を返す.metric- 指標種別.estimate- 算出値
accuracy(leads_results,
truth = purchased,
estimate = .pred_class)
# A tibble: 1 x 3
.metric .estimator .estimate
<chr> <chr> <dbl>
1 accuracy binary 0.759
感度(Sensitivity)
多くの場合、精度だけが最良の指標ではない
leads_dfでは- 全てを「no」と分類しても精度64%
【感度(Sensitivity)】
陽性のうち正しく陽性と判定した割合
- 購入した顧客のうち、正しく予測した割合は?
- 偽陰性が少ないほど感度は高い
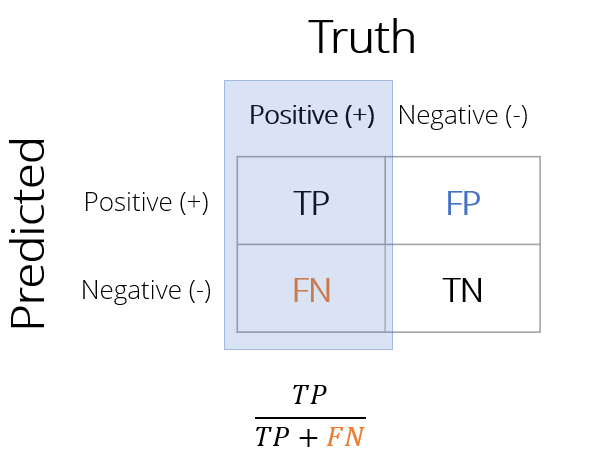
感度の計算
sens() 関数
- 引数は
conf_mat()/accuracy()と同様 .estimate列に感度を返す
sens(leads_results,
truth = purchased,
estimate = .pred_class)
# A tibble: 1 x 3
.metric .estimator .estimate
<chr> <chr> <dbl>
1 sens binary 0.617
特異度(Specificity)
【特異度(Specificity)】は、陰性のうち正しく陰性と判定した割合
- 購入しなかった顧客のうち、正しく予測した割合は?
- 偽陽性が少ないほど特異度は高い
【1 − 特異度】
- 偽陽性率(FPR)とも呼ぶ
- 真の陰性に対する偽陽性の割合
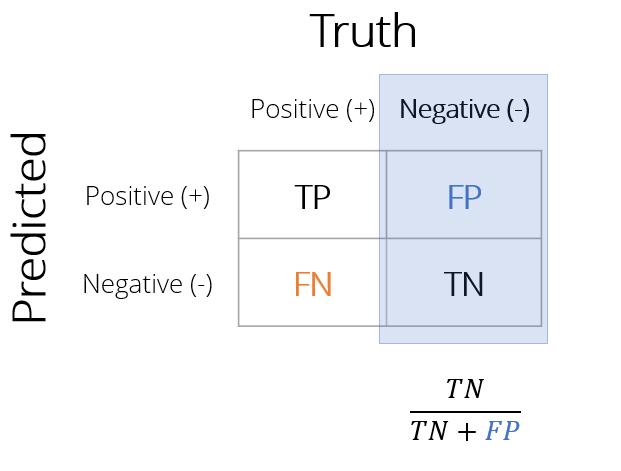
特異度の計算
spec() 関数
- 引数は
sens()と同じ .estimate列に特異度を返す
spec(leads_results,
truth = purchased,
estimate = .pred_class)
# A tibble: 1 x 3
.metric .estimator .estimate
<chr> <chr> <dbl>
1 spec binary 0.840
指標セットの作成
ユーザー定義の指標セット
metric_set()関数- 選んだ
yardstick指標でカスタム関数を作成 - 指標関数名を
metric_set()に渡す - 作成した関数で一括計算
- 選んだ
custom_metrics <-
metric_set(accuracy, sens, spec)
custom_metrics(leads_results,
truth = purchased,
estimate = .pred_class)
# A tibble: 3 x 3
.metric .estimator .estimate
<chr> <chr> <dbl>
1 accuracy binary 0.759
2 sens binary 0.617
3 spec binary 0.840
多様な指標
【2値分類の指標】
2値分類には多様な指標
accuracy(),kap(),sens(),spec(),ppv(),npv(),mcc(),j_index(),bal_accuracy(),detection_prevalence(),precision(),recall(),f_meas()
conf_mat()の結果をsummary()に渡すと一括計算
conf_mat(leads_results,

         truth = purchased,

estimate = .pred_class) %>%
summary()
# A tibble: 13 x 3
   .metric              .estimator .estimate
   <chr>                <chr>          <dbl>
 1 accuracy             binary         0.759
 2 kap                  binary         0.466
 3 sens                 binary         0.617
 4 spec                 binary         0.840
 5 ppv                  binary         0.685
 6 npv                  binary         0.795
 7 mcc                  binary         0.468
 8 j_index              binary         0.456
 9 bal_accuracy         binary         0.728
10 detection_prevalence binary         0.325
11 precision            binary         0.685
12 recall               binary         0.617
13 f_meas               binary         0.649
Passons à la pratique !
R での tidymodels によるモデリング

