Rでの欠損データの扱い方
Nicholas Tierney
Statistician
代入でデータ構造を理解する
代入値の可視化と探索
impute_below(c(5,6,7,NA,9,10))
5.00000 6.00000 7.00000 4.40271 9.00000 10.00000
impute_below_if()
impute_below_if(data, is.numeric)
impute_below_at()
impute_below_at(data, vars(var1,var2))
impute_below_all()
impute_below_all(data)
df
# A tibble: 6 x 1
   var1
  <dbl>
1     5
2     6
3     7
4    NA
5     9
6    10
impute_below_all(df)
# A tibble: 6 x 1
   var1
  <dbl>
1  5
2  6
3  7
4  4.40
5  9
6 10
bind_shadow(df)
# A tibble: 6 x 2
   var1 var1_NA
  <dbl> <fct>
1  5    !NA
2  6    !NA
3  7    !NA
4  NA    NA
5  9    !NA
6 10    !NA
bind_shadow(df) %>% impute_below_all()
# A tibble: 6 x 2
   var1 var1_NA
  <dbl> <fct>
1  5    !NA
2  6    !NA
3  7    !NA
4  4.40 NA
5  9    !NA
6 10    !NA
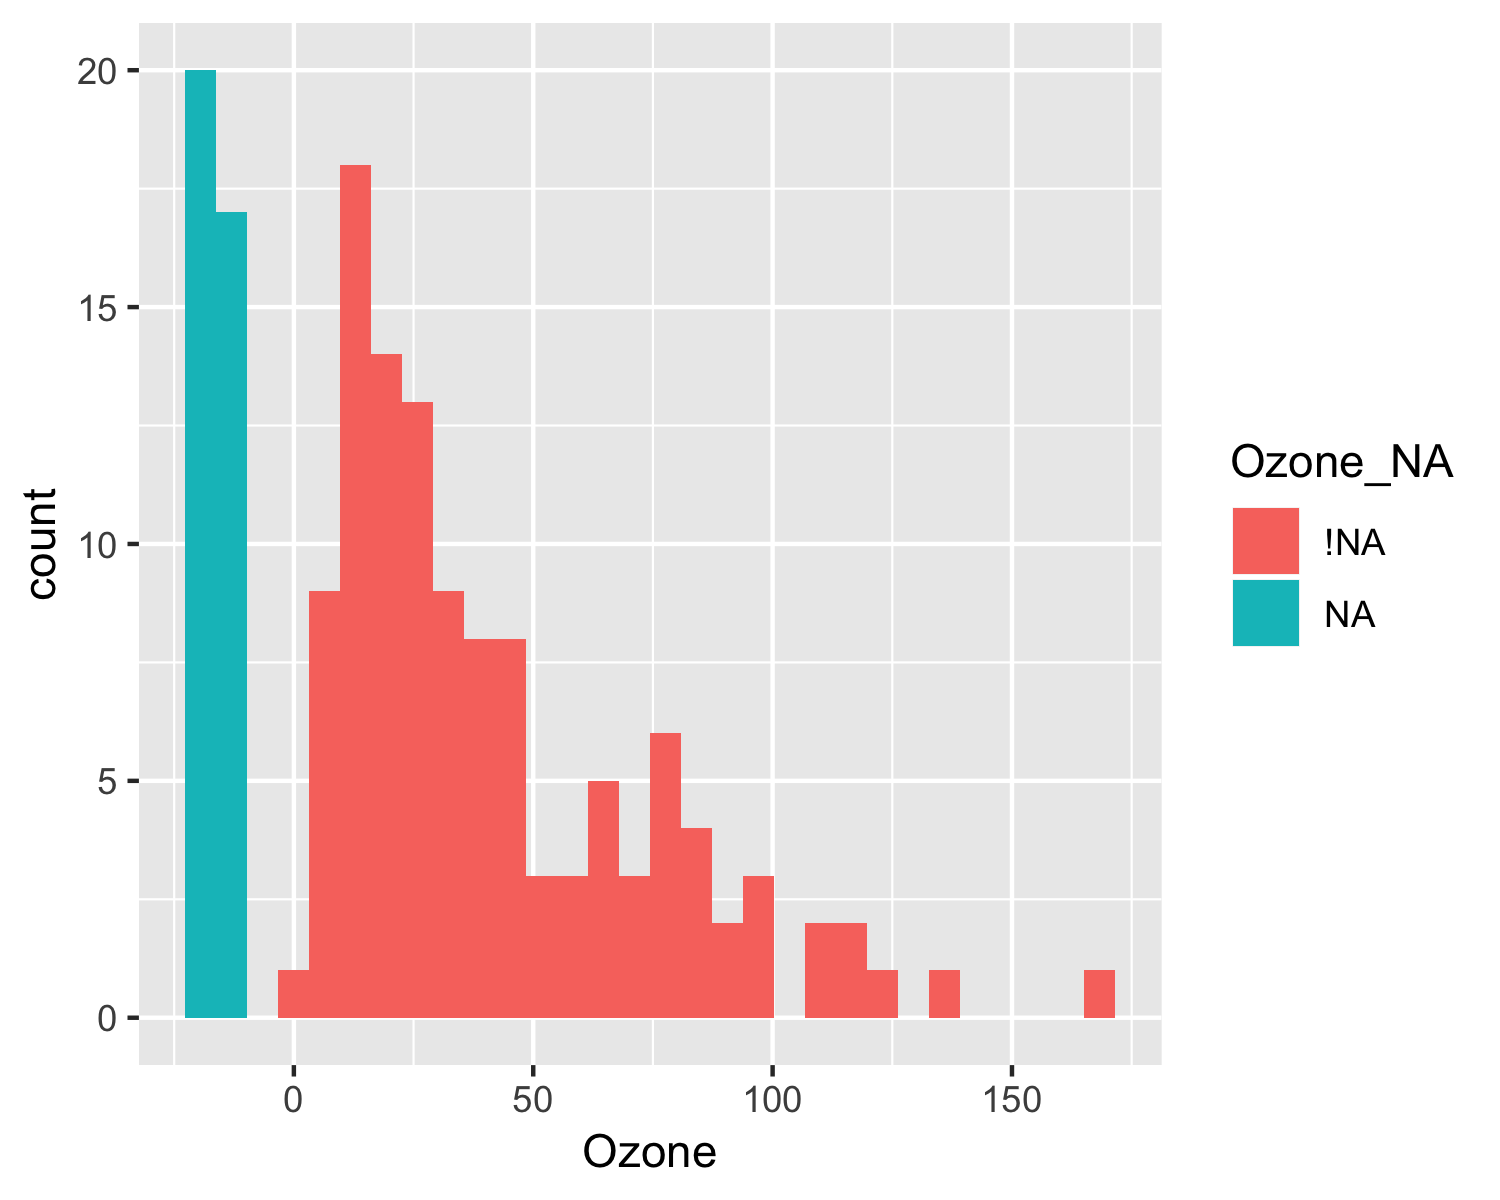
aq_imp <- airquality %>%
   bind_shadow() %>%
   impute_below_all()

ggplot(aq_imp,
       aes(x = Ozone,
           fill = Ozone_NA)) +
   geom_histogram()
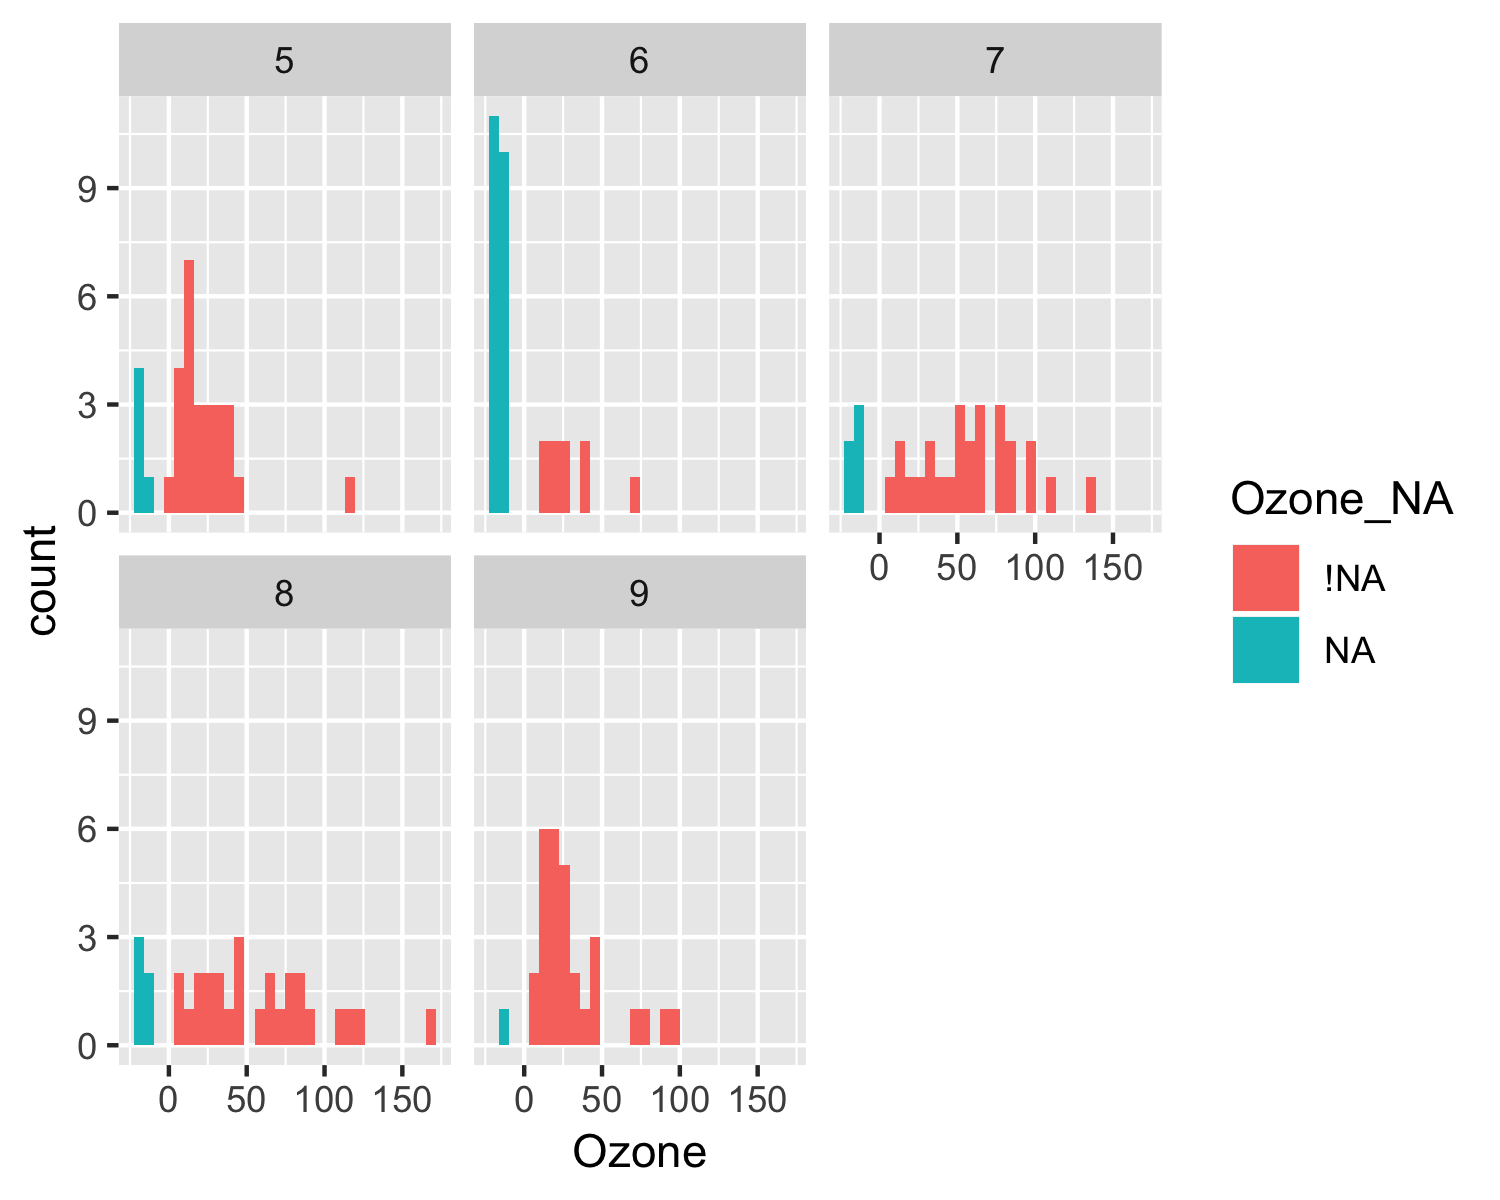
ggplot(aq_imp,
       aes(x = Ozone,
           fill = Ozone_NA)) +
  geom_histogram() +
  facet_wrap(~ Month)
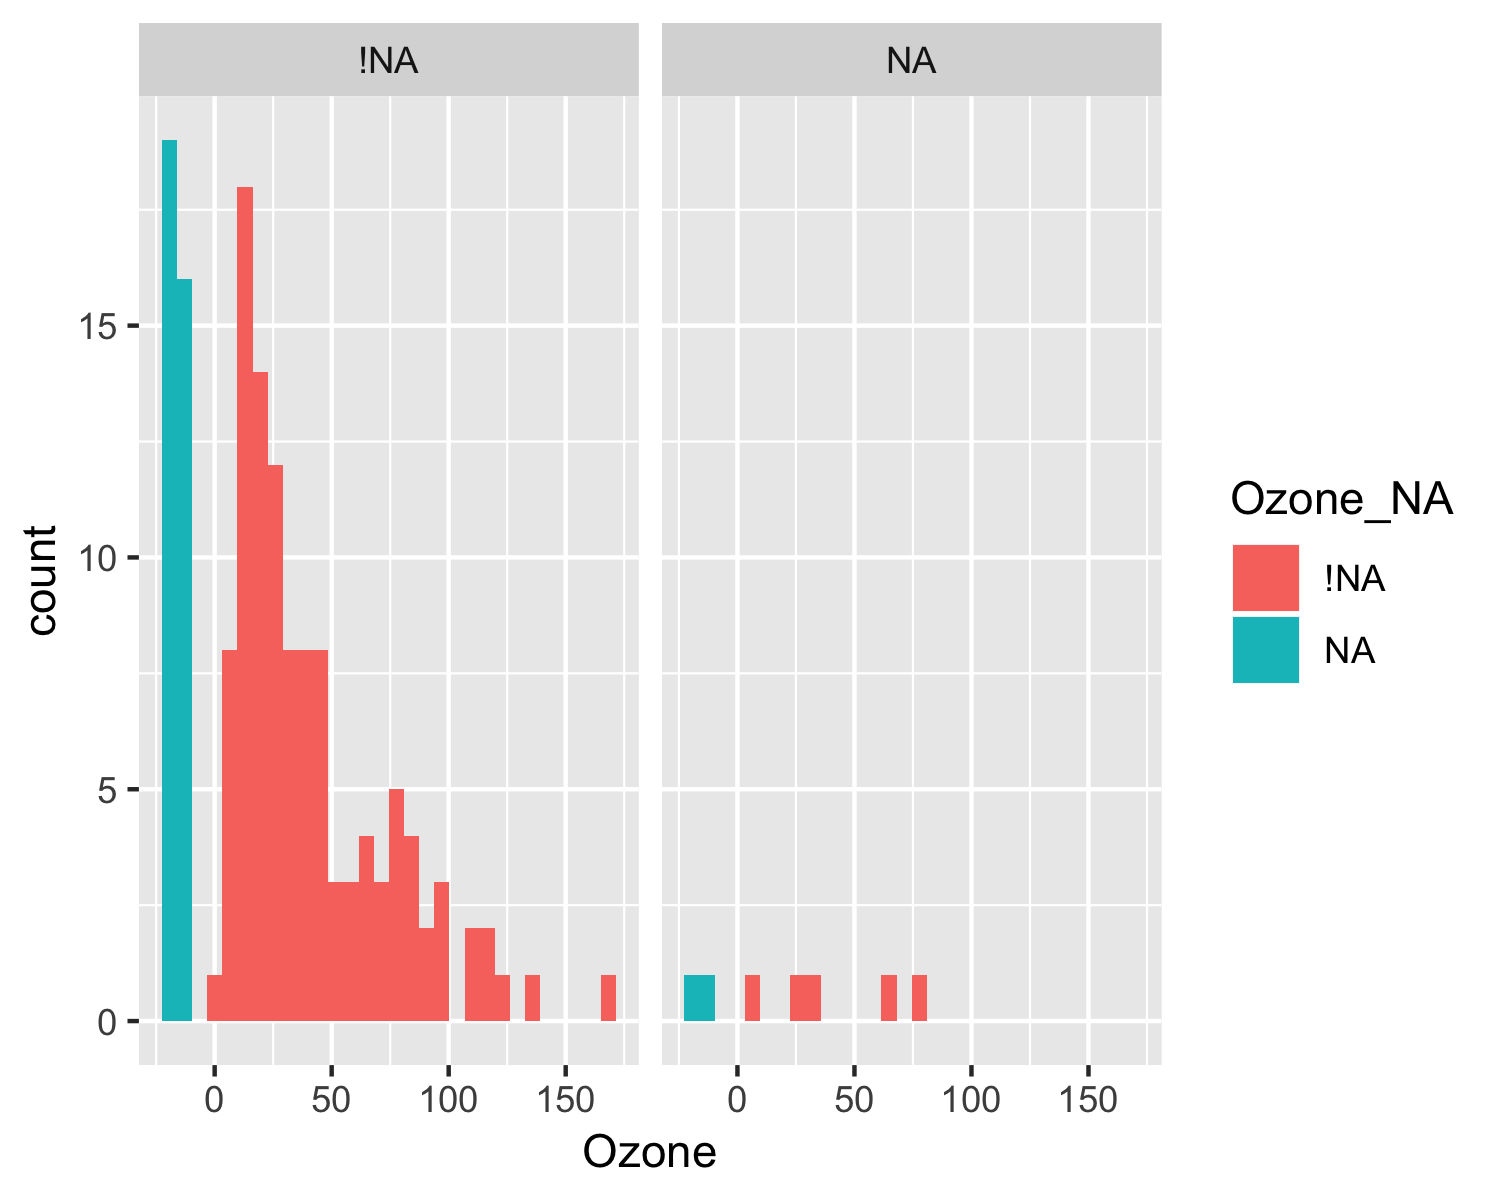
ggplot(aq_imp,
       aes(x = Ozone,
           fill = Ozone_NA)) +
  geom_histogram() +
  facet_wrap(~ Solar.R_NA)
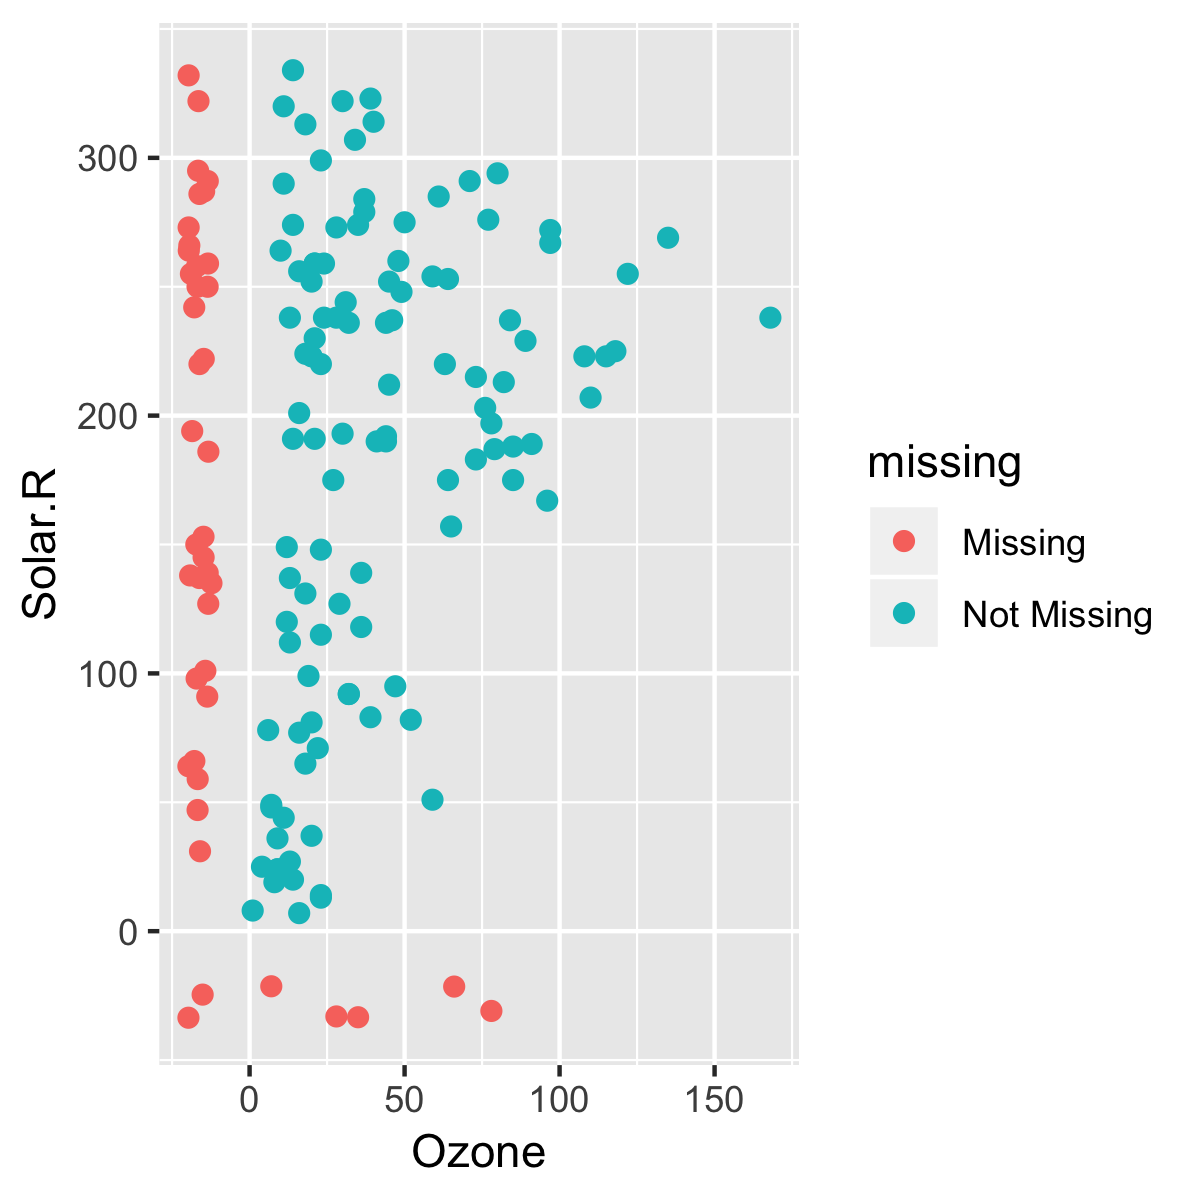
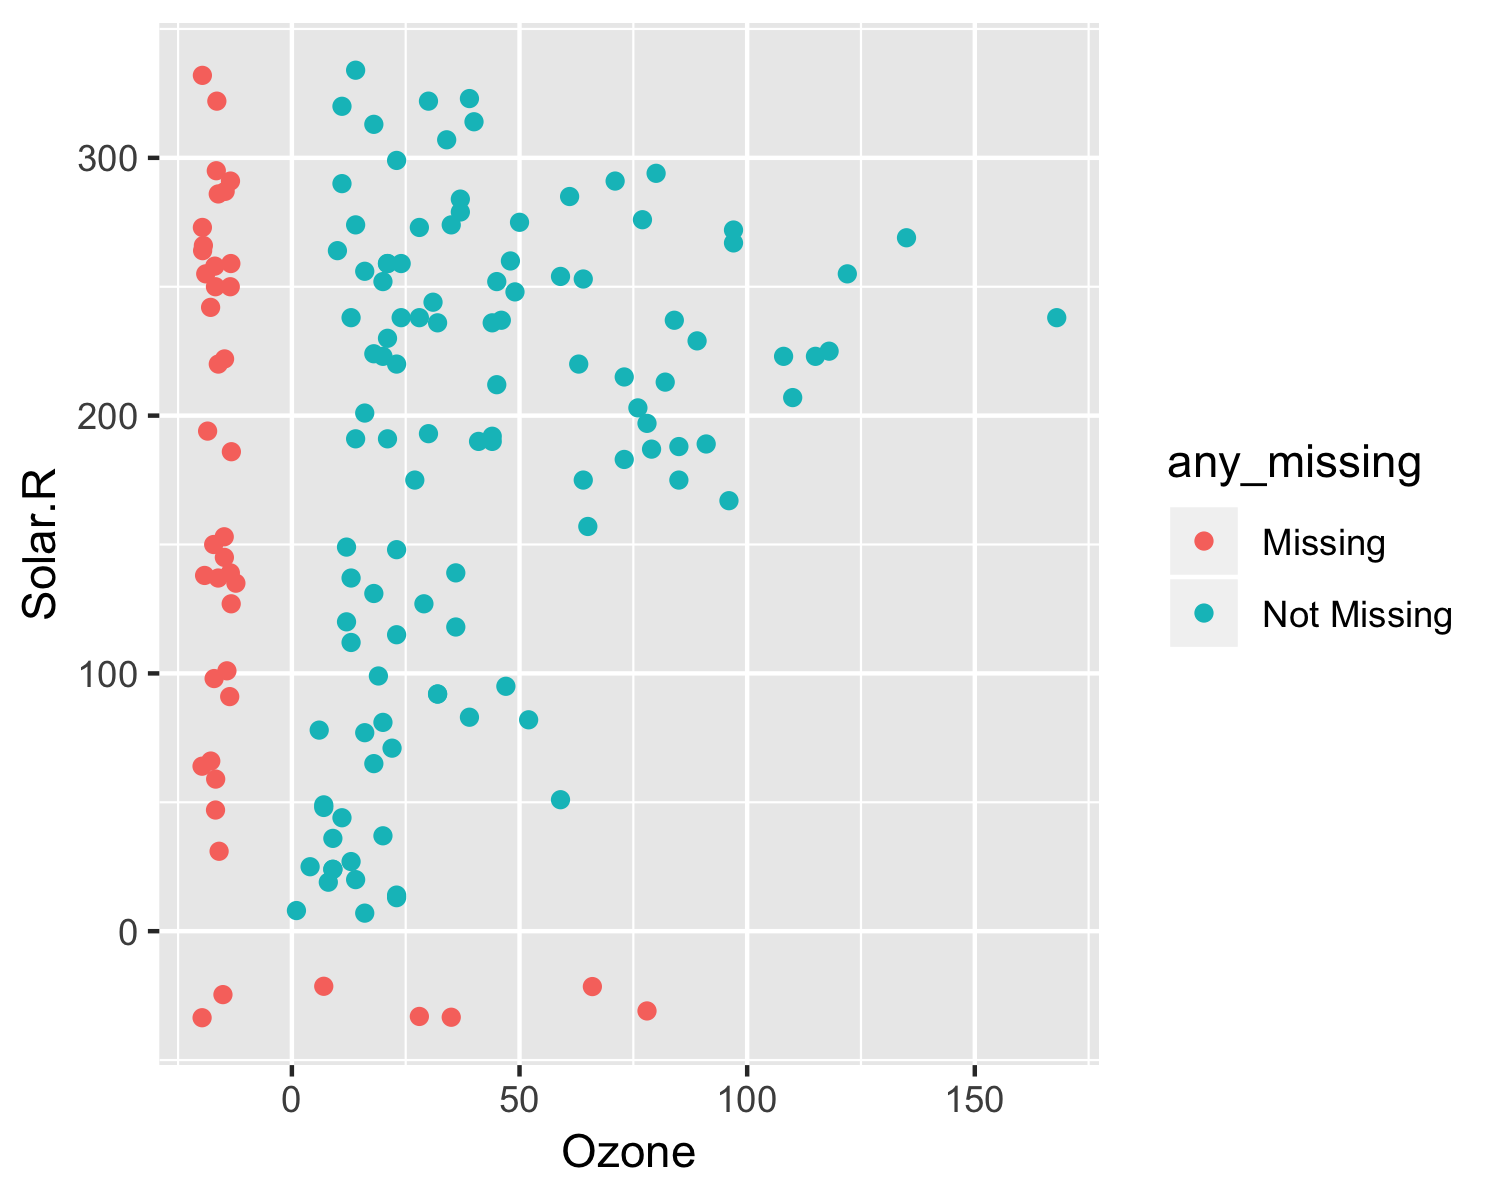
aq_imp <- airquality %>%
  bind_shadow() %>%
  add_label_shadow() %>%
  impute_below_all()

ggplot(aq_imp,
       aes(x = Ozone,
           y = Solar.R,
           color = any_missing)) +
  geom_point()