ヒートマップ

Python で学ぶマーケットバスケット分析

Isaiah Hull

Visiting Associate Professor of Finance, BI Norwegian Business School

MovieLens データセット

import pandas as pd

# Load ratings data.
ratings = pd.read_csv('datasets/movie_ratings.csv')
print(ratings.head())
   userId  movieId  title
0    3149    54286  Bourne Ultimatum, The (2007) 
1    3149     1220  Blues Brothers, The (1980)
2    3149     4007  Wall Street (1987)
3    3149     7156  Fog of War: Eleven...
4    3149    97304  Argo (2012)
Python で学ぶマーケットバスケット分析

評価から「トランザクション」を作成

# Recover unique user IDs.
user_id = movies['userId'].unique()

# Create library of highly rated movies for each user.
libraries = [list(ratings[ratings['userId'] == u].title) for u in user_id]

# Print example library.
print(library[0])
['Battlestar Galactica (2003)',
 'Gorgon, The (1964)',
 'Under the Skin (2013)',
 'Upstream Color (2013)',
 'Destry Rides Again (1939)',
 'Dr. Phibes Rises Again (1972)']
Python で学ぶマーケットバスケット分析

トランザクションのワンホット化

from mlxtend.preprocessing import TransactionEncoder

# Instantiate transaction encoder.
encoder = TransactionEncoder()

# One-hot encode libraries.
onehot = encoder.fit(libraries).transform(libraries)

# Use movie titles as column headers.
onehot = pd.DataFrame(onehot, columns = encoder.columns_)

# Print onehot header.
print(onehot.head())
Python で学ぶマーケットバスケット分析

トランザクションのワンホット化


   (500) Days of Summer (2009)  .45 (2006)  10 Things I Hate About You (1999) 
0                        False       False                              False   
1                        False       False                              False   
2                        False       False                              False   
3                        False       False                              False   
4                        False       False                              False
Python で学ぶマーケットバスケット分析

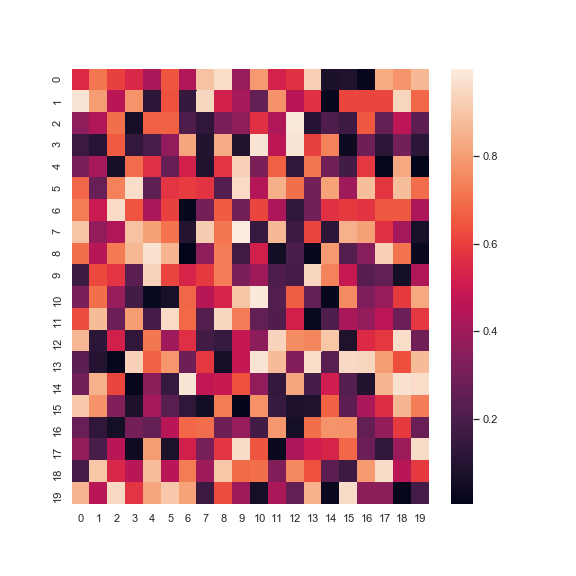
ヒートマップとは?

この図はヒートマップの例です。

Python で学ぶマーケットバスケット分析

データの準備

  1. ルールを生成
    • Apriori とアソシエーションルールを使用。
  2. 前件・後件を文字列に変換
    • mlxtend では既定で frozen set。
  3. ルールを行列に変換
    • ヒートマップに適した形式。
Python で学ぶマーケットバスケット分析

データの準備

from mlxtend.frequent_patterns import association_rules, apriori
import seaborn as sns
# Apply the apriori algorithm
frequent_itemsets = apriori(onehot, min_support=0.10,
                            use_colnames=True, max_len=2)

# Recover the association rules
rules = association_rules(frequent_itemsets)
Python で学ぶマーケットバスケット分析

ヒートマップの作成

# Convert antecedents and consequents into strings
rules['antecedents'] = rules['antecedents'].apply(lambda a: ','.join(list(a)))
rules['consequents'] = rules['consequents'].apply(lambda a: ','.join(list(a)))
# Print example.
print(rules[['antecedents','consequents']])
            antecedents                    consequents
0  Batman Begins (2005)  Dark Knight Rises, The (2012)
Python で学ぶマーケットバスケット分析

ヒートマップの作成

# Transform antecedent, consequent, and support columns into matrix
support_table = rules.pivot(index='consequents', columns='antecedents', 
                                values='support')
# Generate heatmap
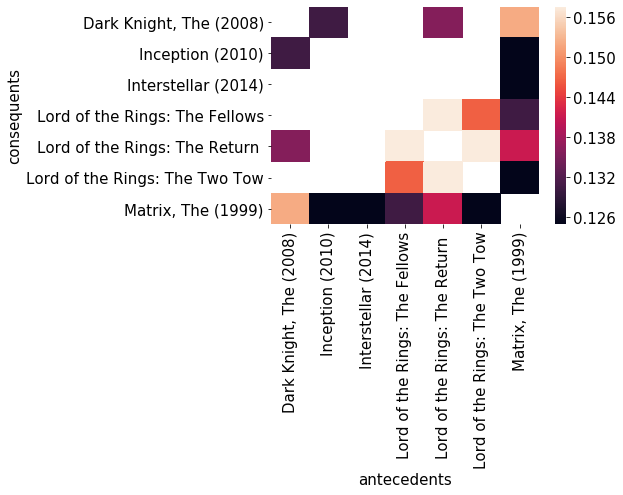
sns.heatmap(support_table)
Python で学ぶマーケットバスケット分析

ヒートマップの作成

この図は MovieLens データから生成したヒートマップです。

Python で学ぶマーケットバスケット分析

ヒートマップのカスタマイズ

sns.heatmap(pivot, annot=True, cbar=False, cmap='ocean')
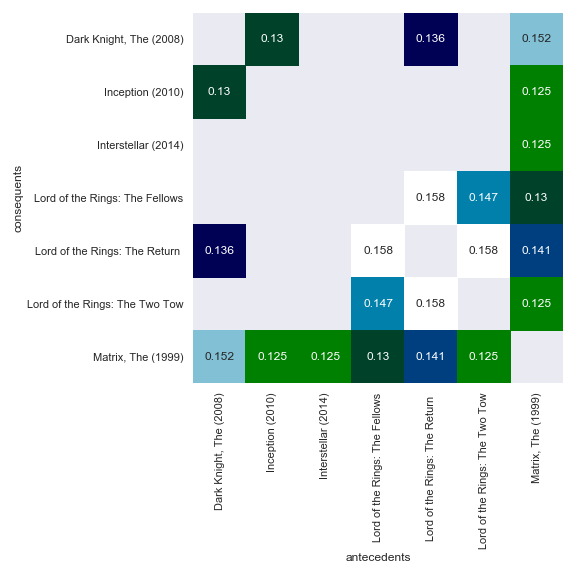
この図はカスタマイズしたヒートマップです。

Python で学ぶマーケットバスケット分析

Ayo berlatih!

Python で学ぶマーケットバスケット分析

Preparing Video For Download...