大学のカラーコーディング

R で作る leaflet のインタラクティブマップ

Rich Majerus

Vice President of Strategy & Planning, Queens University of Charlotte

色(と情報)の追加
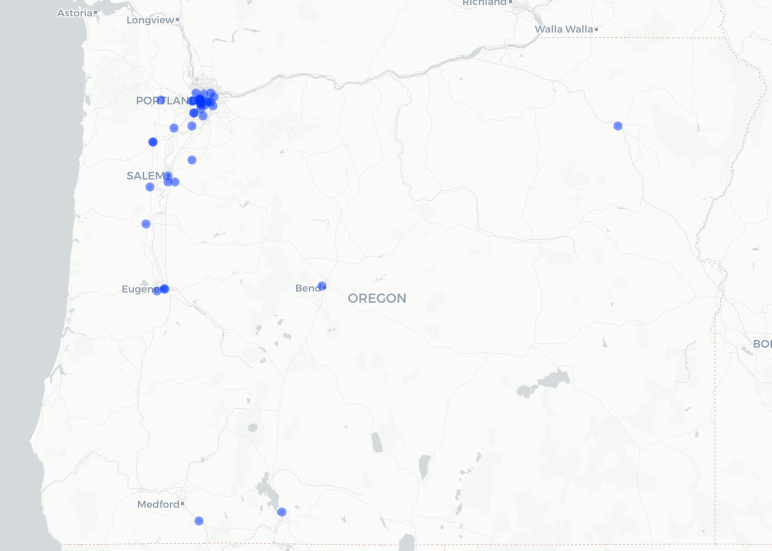
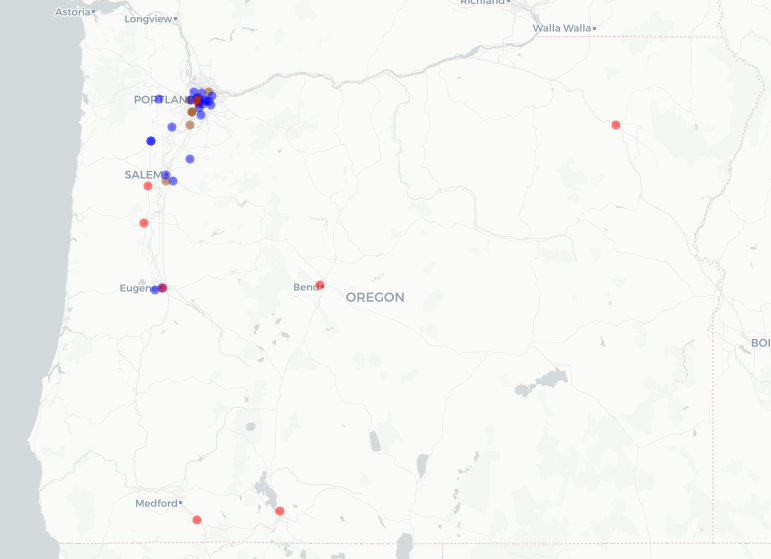
オレゴン州の大学 1

オレゴン州の大学 2

R で作る leaflet のインタラクティブマップ

色の指定を覚える

オレゴン州の大学 3

R で作る leaflet のインタラクティブマップ

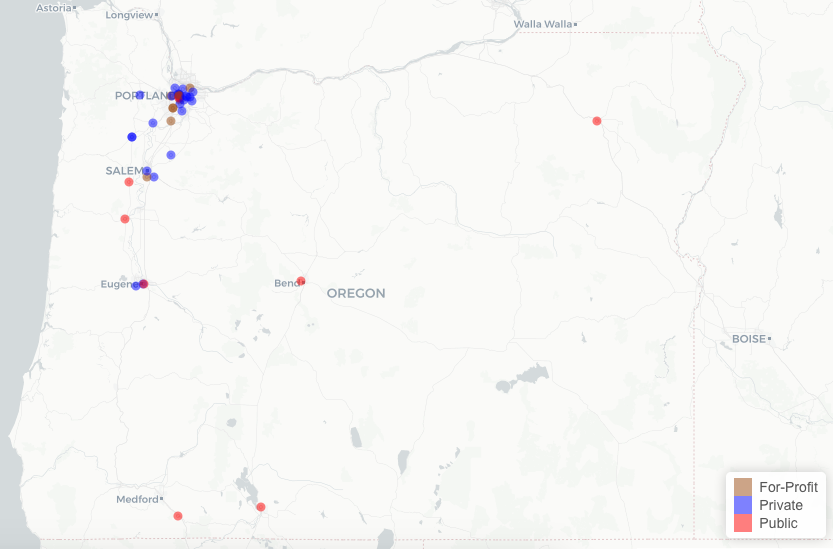
`colorFactor()`

OR <- ipeds %>% 
      filter(state == "OR")

pal <- colorFactor(palette = c("red", "blue", "#9b4a11"), levels = c("Public", "Private", "For-Profit"))
oregon_colleges <- OR %>% 
        leaflet() %>% 
        addProviderTiles("CartoDB") %>% 
        addCircleMarkers(radius = 2, 
                         color = ~pal(sector_label), label = ~name)
oregon_colleges %>% 
    addLegend(position = "bottomright",pal = pal, 
              values = c("Public", "Private", "For-Profit"))
R で作る leaflet のインタラクティブマップ

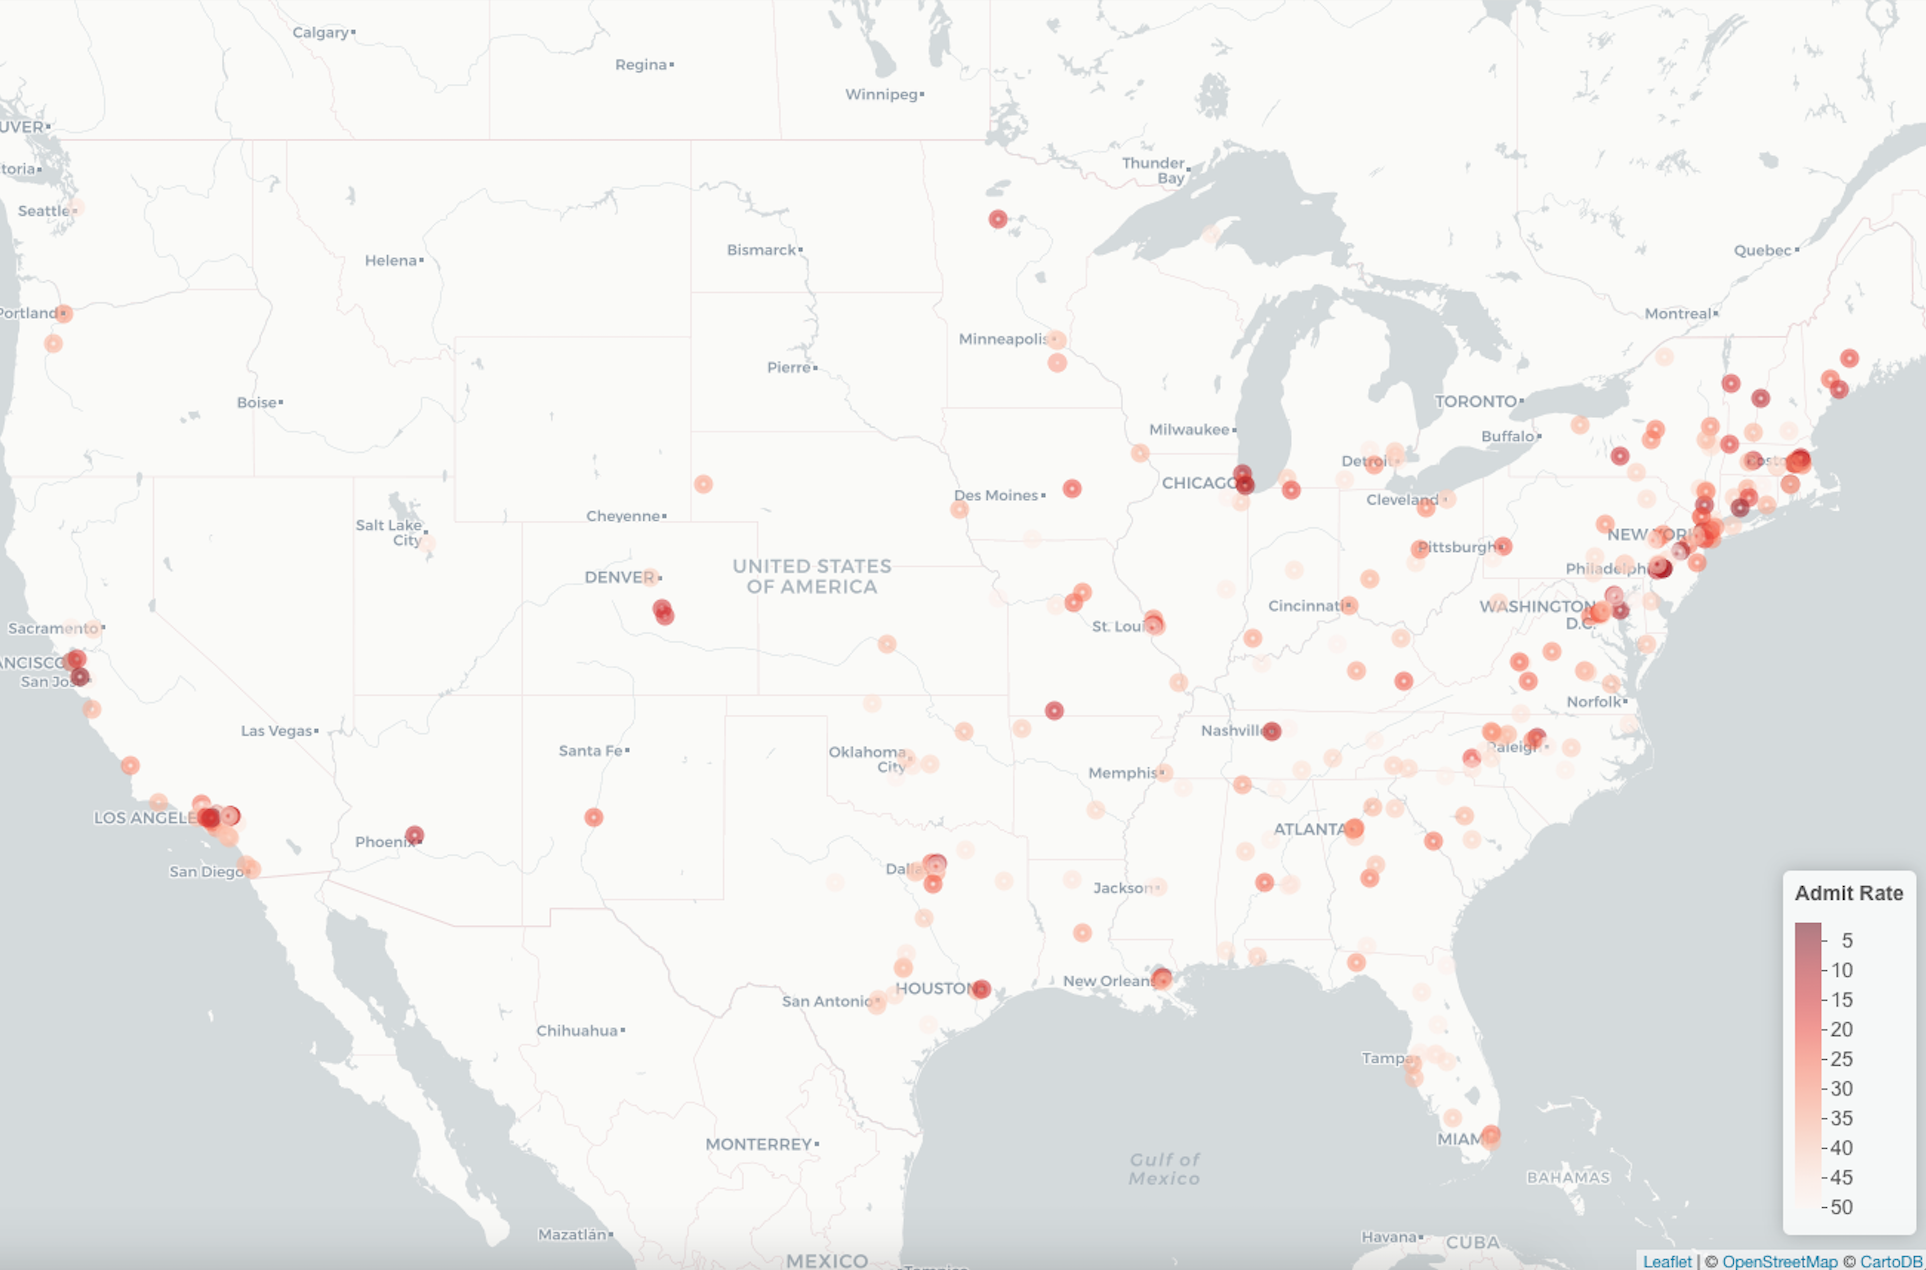
`colorNumeric()`

admit <- admit %>% 
         filter(!is.na(rate),rate < 50, rate > 0)
 pal <- colorNumeric(palette = "Reds", domain = c(1:50), 
                     reverse = TRUE)
admit_map <- admit %>% 
    leaflet() %>% 
    addProviderTiles("CartoDB")  %>% 
    addCircleMarkers(radius = 4, color = ~pal(rate), 
                     label = ~name)  %>%
    addLegend(title = "Admit Rate", pal = pal, values = c(1:50), 
              position = "bottomright")
R で作る leaflet のインタラクティブマップ

大学の合格率

R で作る leaflet のインタラクティブマップ

カラーパレットの選択

# see https://colorbrewer2.org/ for interactive examples
library(RColorBrewer)
display.brewer.all()
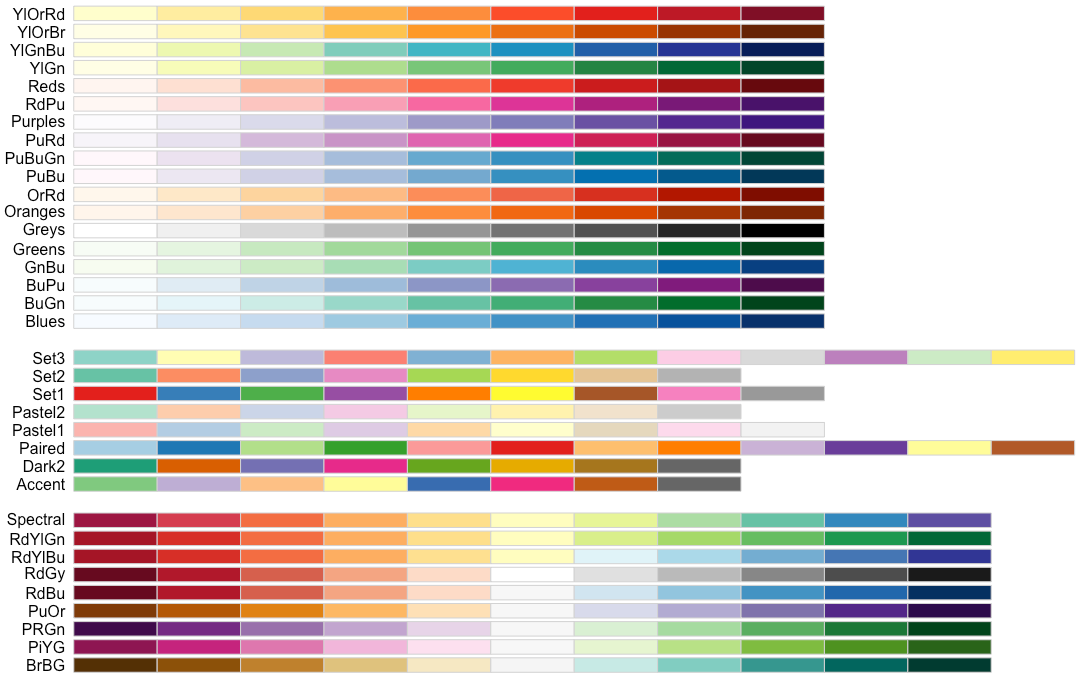
RColorBrewerのパレット

R で作る leaflet のインタラクティブマップ

練習しましょう!

R で作る leaflet のインタラクティブマップ

Preparing Video For Download...