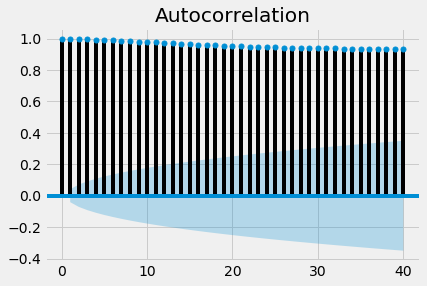
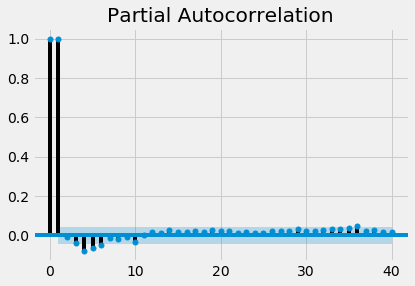
Visualizing Time Series Data in Python
Thomas Vincent
Head of Data Science, Getty Images
t_1
, t_2
, t_3
, ...) and its own values lagged by 3 time points, i.e. (t_4
, t_5
, t_6
, ...)
statsmodels
is a Python module that provides classes and functions for the estimation of many different statistical models, as well as for conducting statistical tests, and statistical data exploration.
import matplotlib.pyplot as plt
from statsmodels.graphics import tsaplots
fig = tsaplots.plot_acf(co2_levels['co2'], lags=40)
plt.show()
order 3
returns the correlation between our time series (t1
, t2
, t3
, ...) and lagged values of itself by 3 time points (t4
, t5
, t6
, ...), but only after removing all effects attributable to lags 1 and 2import matplotlib.pyplot as plt
from statsmodels.graphics import tsaplots
fig = tsaplots.plot_pacf(co2_levels['co2'], lags=40)
plt.show()
Visualizing Time Series Data in Python