Plot your first time series
Visualizing Time Series Data in Python

Thomas Vincent
Head of Data Science, Getty Images
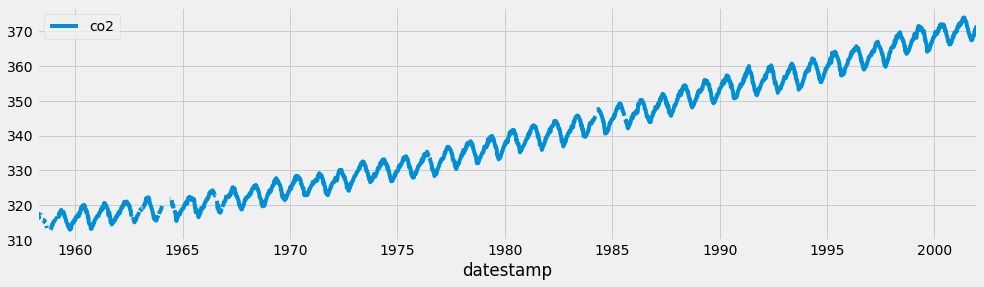
Plotting time series data
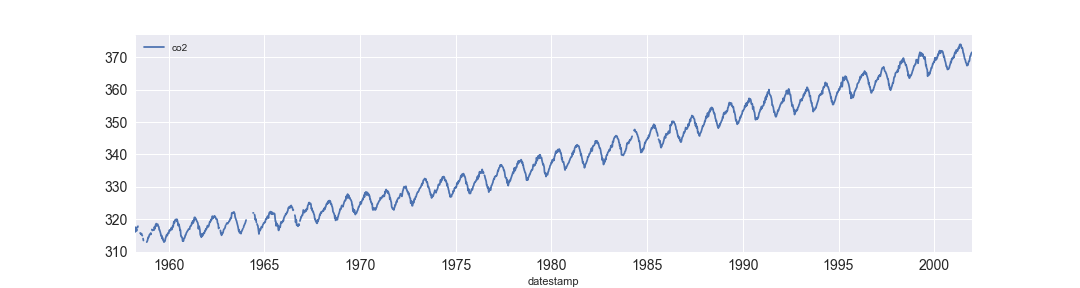
FiveThirtyEight style
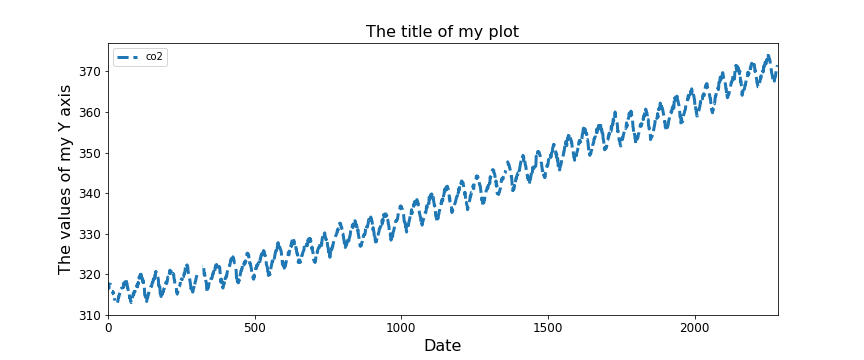
Describing your graphs with labels
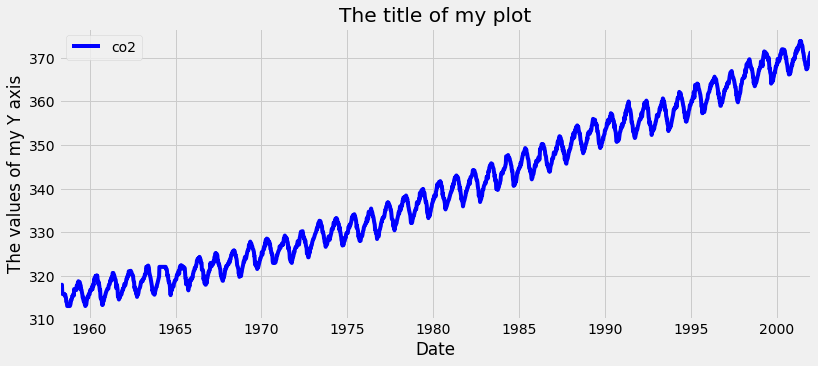
Figure size, linewidth, linestyle and fontsize