xts と plot() の復習
Rで学ぶ時系列データの可視化

Arnaud Amsellem
Quantitative Trader and creator of the R Trader blog
xts の復習
- 時系列を扱う特別なクラス
- eXtensible Time Series
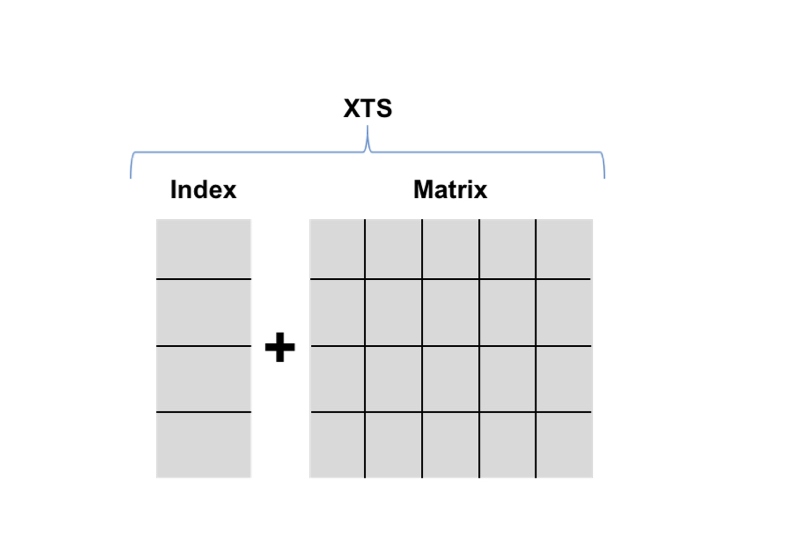
- xts = 時間インデックス + 行列
- インデックスは時間オブジェクト:
Date,POSIX Time,timeDate,chron
plot() の使用
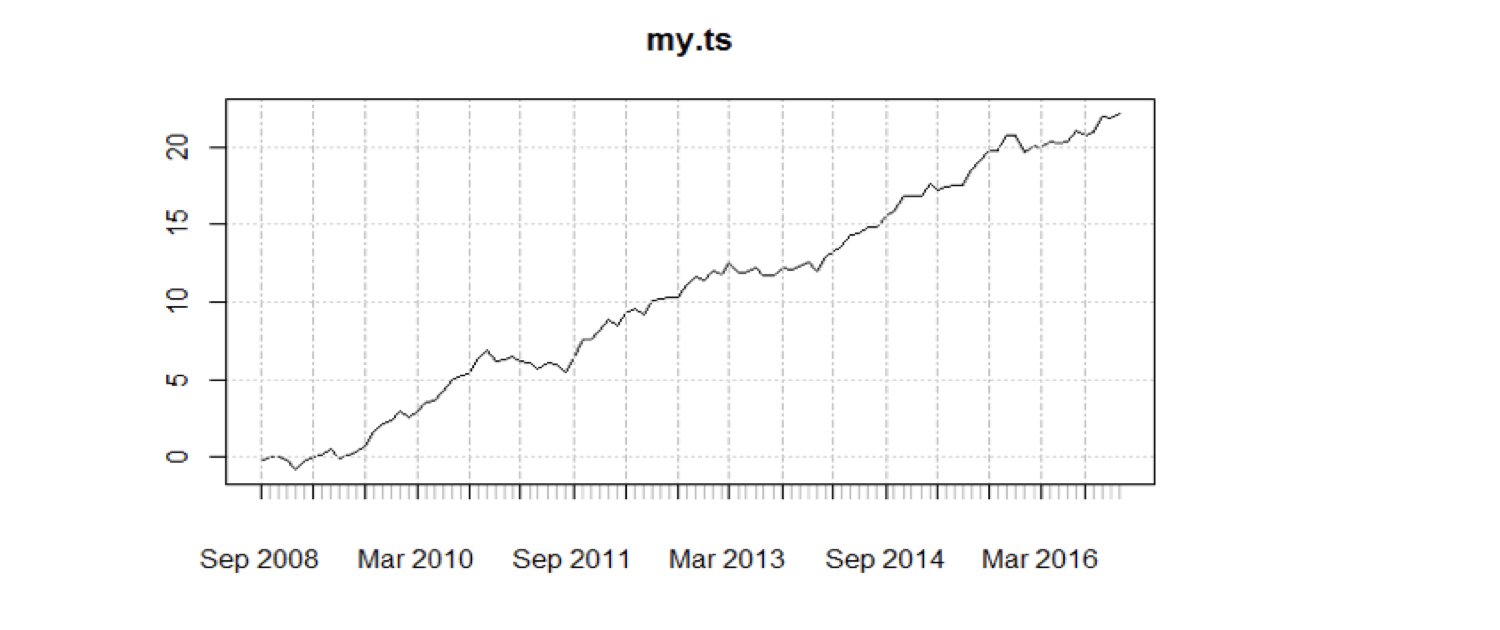
plot(my_ts)
plot() の使用
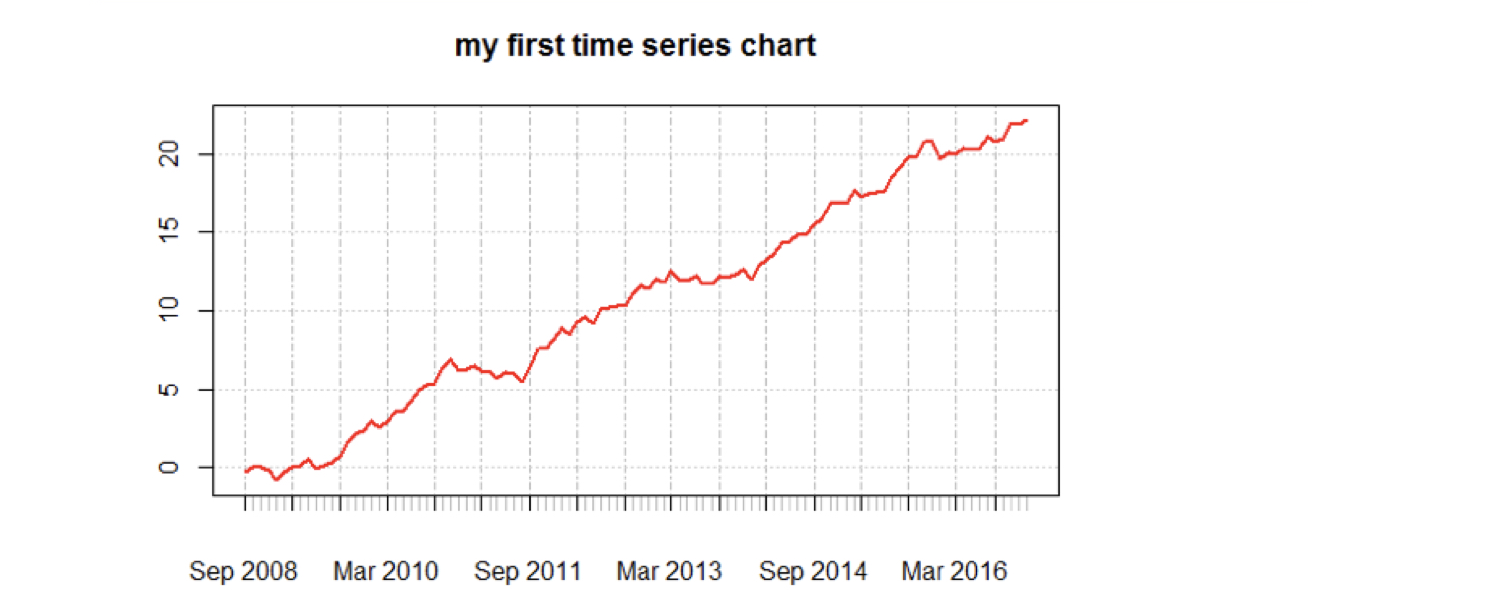
plot(my_ts, main = "my first time series")
lines(my_ts, col = "red", lwd = 2)
plot() の使用
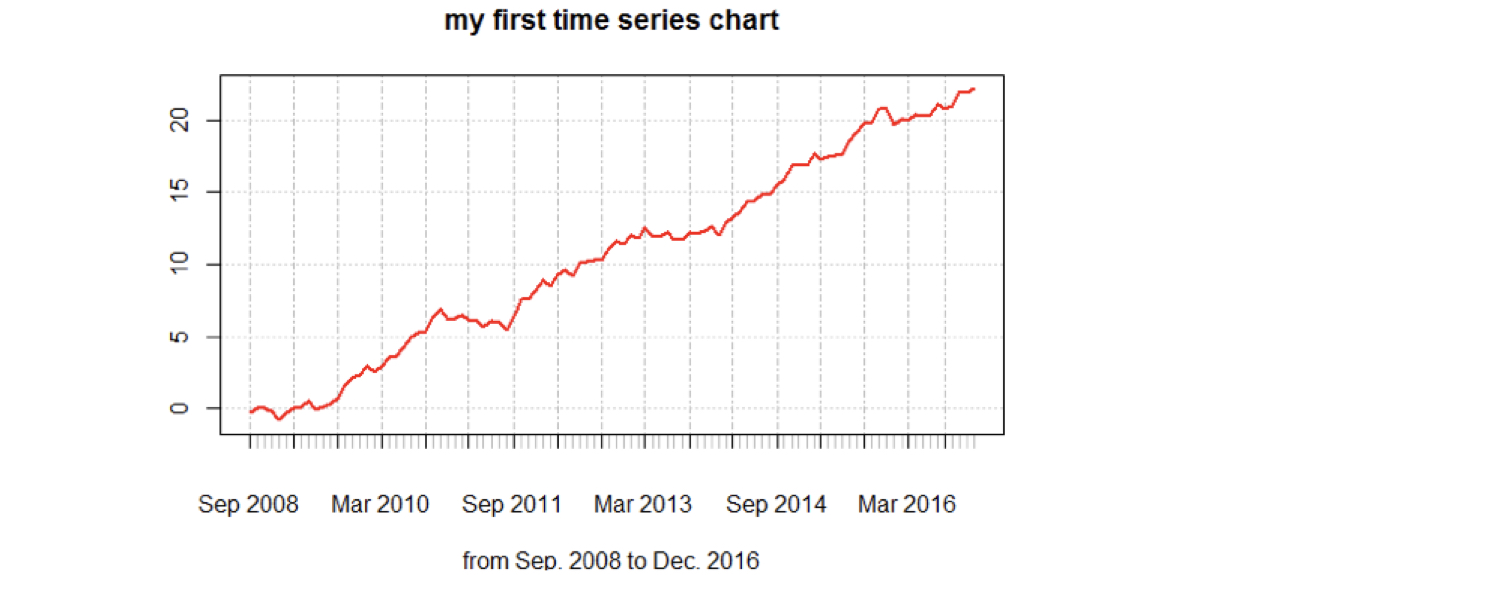
plot(my_ts, main = "my first time series",
            sub = "from Sep. 2008 to Dec. 2016")
lines(my_ts, col = "red", lwd = 2)

