R で学ぶ plotly によるインタラクティブ可視化
Adam Loy
Statistician, Carleton College
head(turnout)
       state state.abbr turnout2018 turnout2014  ballots      vep      vap
1    Alabama         AL       0.474       0.332  1725000  3641209  3802714
2     Alaska         AK       0.537       0.548   280000   521777   554426
3    Arizona         AZ       0.486       0.341  2385000  4910625  5519036
4   Arkansas         AR       0.412       0.403   895000  2171940  2319740
5 California         CA       0.478       0.307 12250000 25635139 30836229
6   Colorado         CO       0.619       0.547  2540000  4103903  4445013
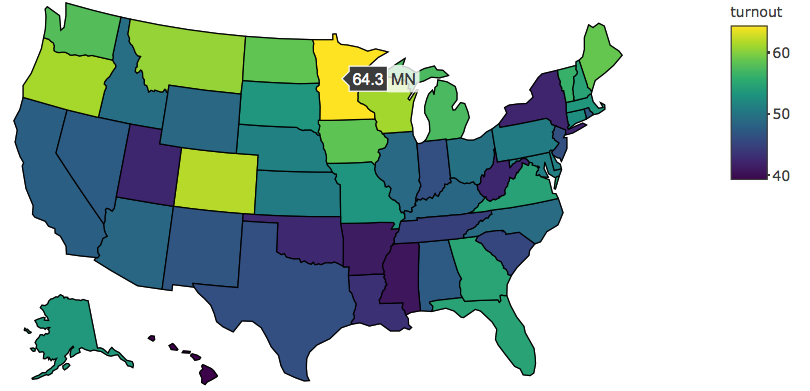
turnout %>%

  plot_geo(locationmode = 'USA-states') %>%

  add_trace(
    z = ~turnout,                   # 色の値を設定
    locations = ~state.abbr         # 事例をポリゴンに対応付け
  ) %>%

  layout(geo = list(scope = 'usa')) # 米国のみを表示
turnout %>%
plot_geo(locationmode = 'USA-states') %>%
add_trace( z = ~turnout, # 色の値を設定 locations = ~state.abbr # 事例をポリゴンに対応付け ) %>%
layout(geo = list(scope = 'usa')) # 米国のみを表示
locationmode: "USA-states" | "ISO-3" | "country names"
"USA-states" | "ISO-3" | "country names"
scope = "usa"
projection = list(type = "mercator")
scale = 1
center = list(lat = ~c.lat, lon = ~c.lon)
c.lat
c.lon