plotly入門

R で学ぶ plotly によるインタラクティブ可視化

Adam Loy

Statistician, Carleton College

plotly

  • インタラクティブかつ動的なWebグラフ用の可視化ライブラリ
  • 複数の形式に対応
    • ビューアウィンドウ
    • R Markdownドキュメント
    • Shinyアプリ
  • 活発な開発とコミュニティサポート
R で学ぶ plotly によるインタラクティブ可視化

静的グラフ vs. インタラクティブグラフ

R で学ぶ plotly によるインタラクティブ可視化

ワインデータ

library(dplyr)
glimpse(wine)
Rows: 178
Columns: 14
$ Type            <fct> 1, 1, 1, 1, 1, 1, 1, 1, 1, 1, 1, 1, 1, 1, 1, 1...
$ Alcohol         <dbl> 14.23, 13.20, 13.16, 14.37, 13.24, 14.20, 14.3...
$ Malic           <dbl> 1.71, 1.78, 2.36, 1.95, 2.59, 1.76, 1.87, 2.15...
...
$ Hue             <dbl> 1.04, 1.05, 1.03, 0.86, 1.04, 1.05, 1.02, 1.06...
$ Dilution        <dbl> 3.92, 3.40, 3.17, 3.45, 2.93, 2.85, 3.58, 3.58...
$ Proline         <int> 1065, 1050, 1185, 1480, 735, 1450, 1290, 1295,...
R で学ぶ plotly によるインタラクティブ可視化

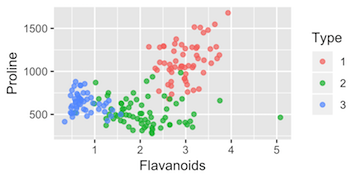
ggplot2散布図

library(ggplot2)
static <- wine %>%
  ggplot(aes(x = Flavanoids, y = Proline, color = Type)) +
  geom_point()
  • データセット、wine
  • 審美的マッピング、aes()
  • レイヤーの追加、geom_point()
R で学ぶ plotly によるインタラクティブ可視化

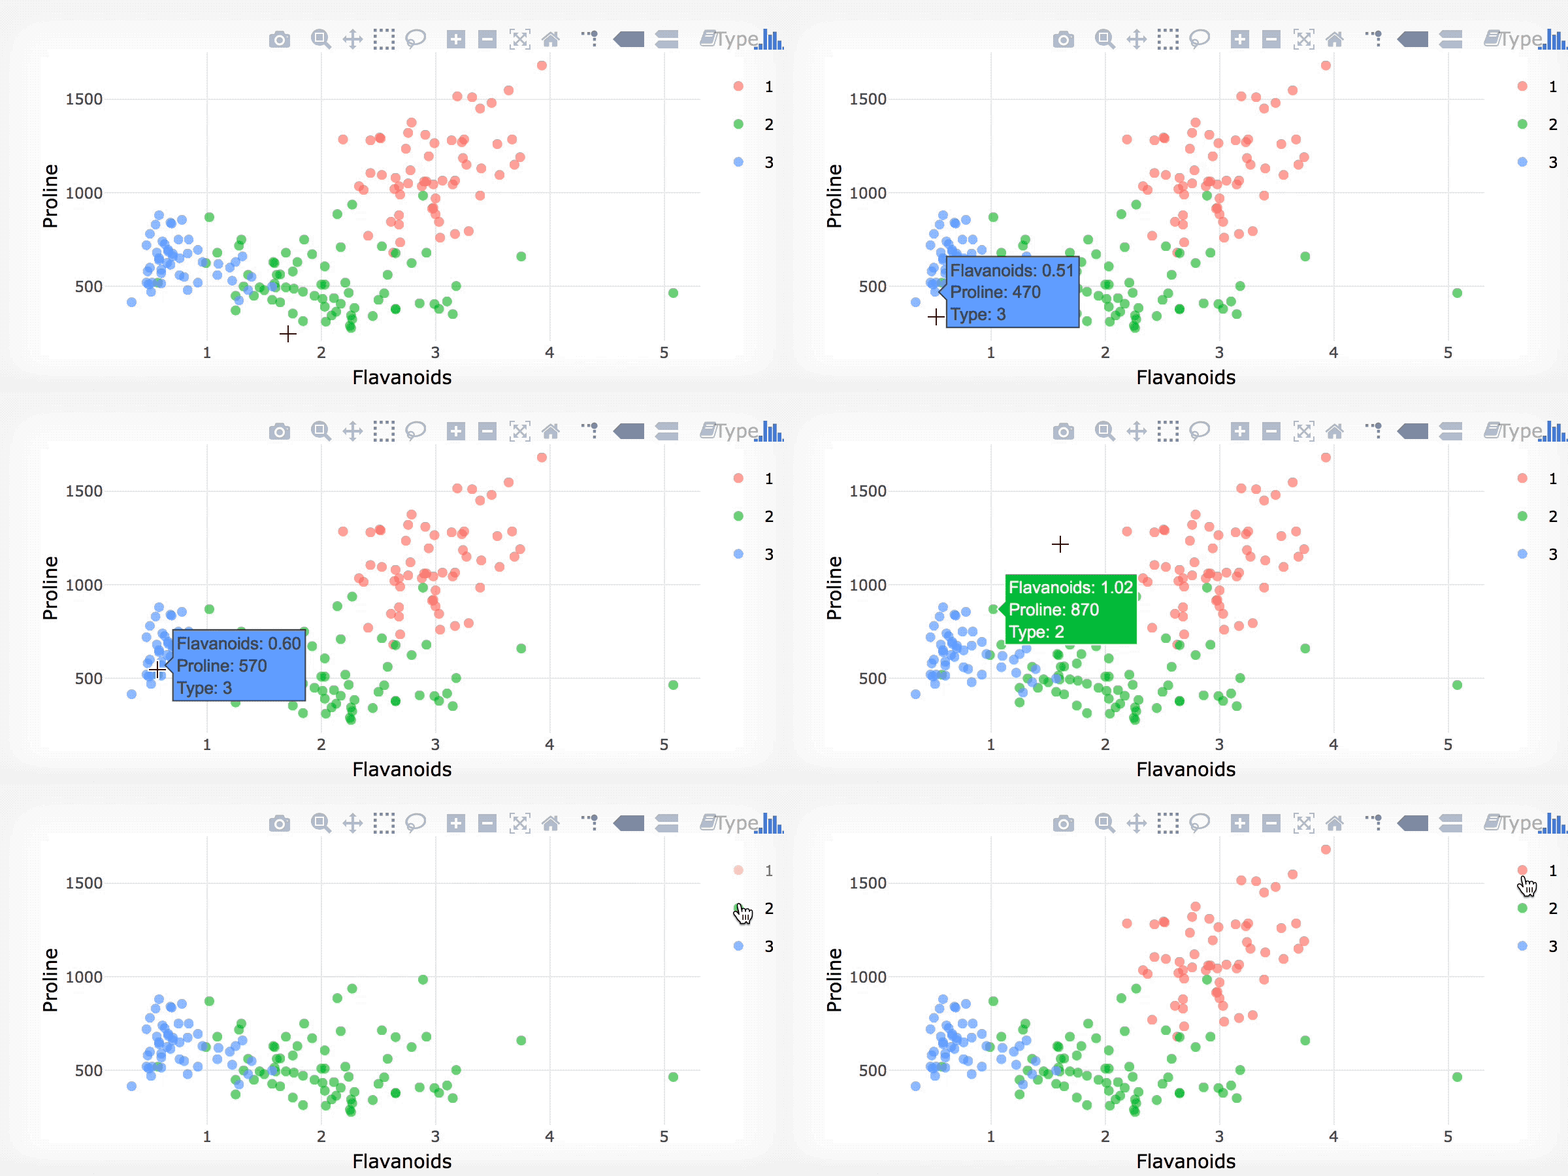
ggplotly()

library(plotly)
ggplotly(static)

R で学ぶ plotly によるインタラクティブ可視化

注意事項

  • インタラクティブ ≠ 良いグラフ

    • 設計が悪ければ、インタラクティブグラフも悪くなる
    • データ可視化のベストプラクティスに従うこと
  • ggplotly()はあくまで出発点

R で学ぶ plotly によるインタラクティブ可視化

練習しましょう!

R で学ぶ plotly によるインタラクティブ可視化

Preparing Video For Download...