R で学ぶ plotly によるインタラクティブ可視化
Adam Loy
Statistician, Carleton College
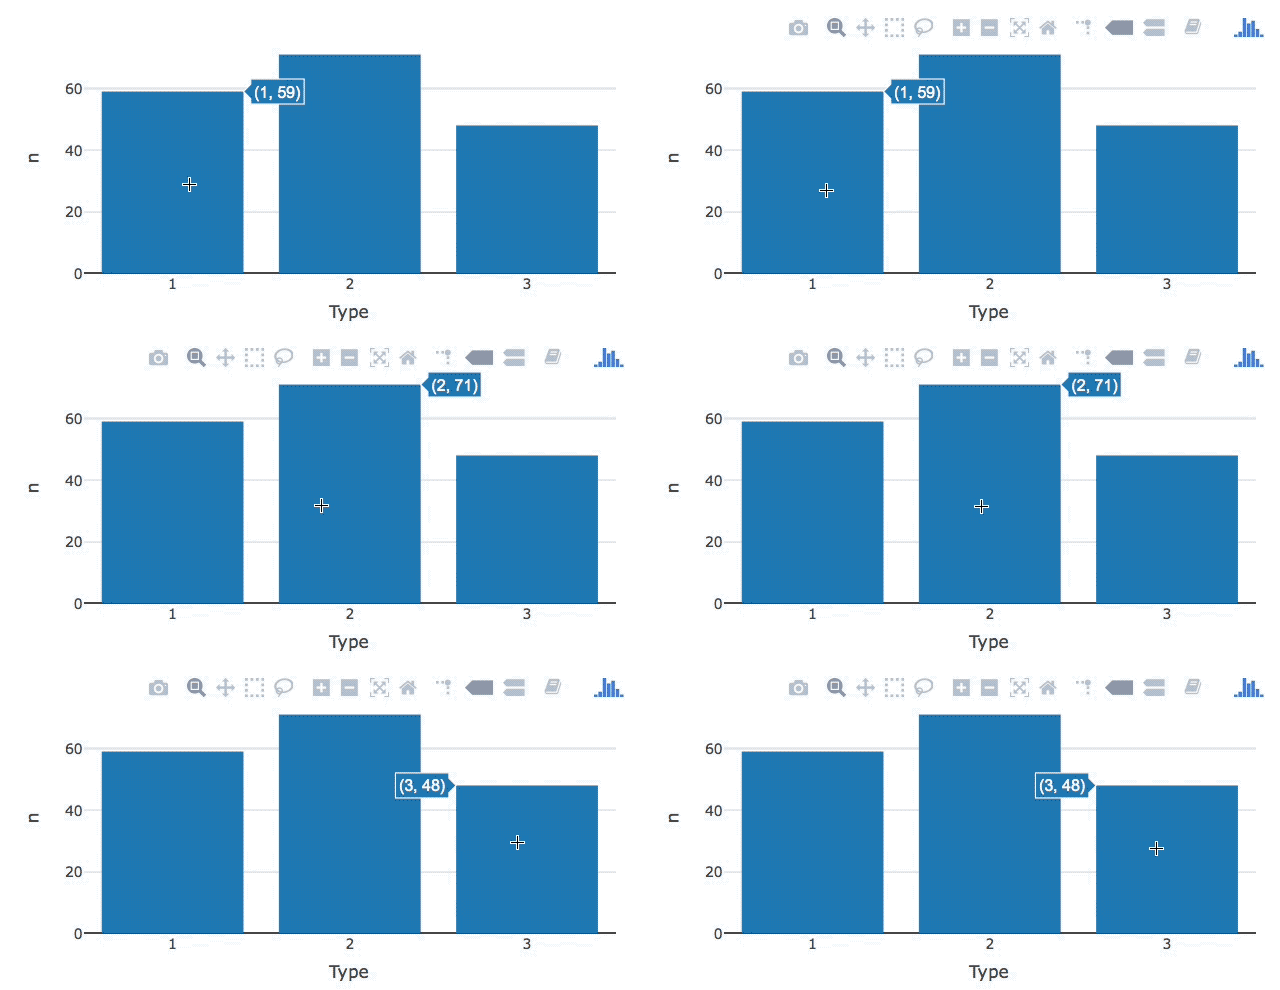
 wine %>%
  count(Type) %>%
  plot_ly(x = ~Type, y = ~n,
      # Changing the default info displayed
          hoverinfo = "y"
  ) %>%
  add_bars()
hoverinfo =
"all"
"x"
"y"
"x+y"
"x+y+z"
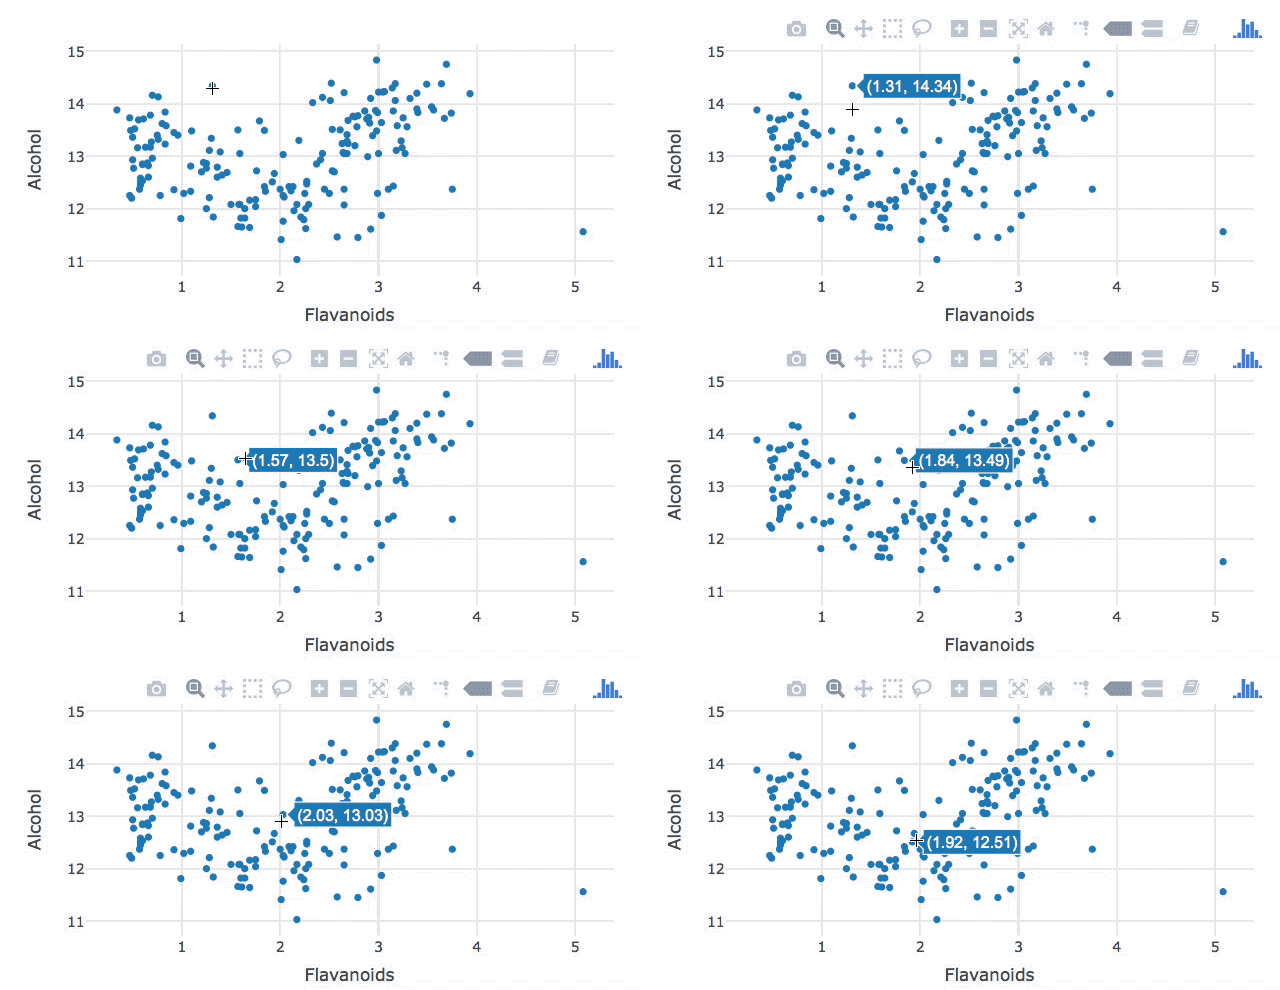
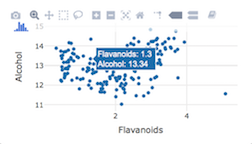
wine %>%
  plot_ly(x = ~Flavanoids, y = ~Alcohol,

    hoverinfo = "text",

    text = ~paste("Flavanoids:", Flavanoids, "<br>",
                  "Alcohol:", Alcohol)

          ) %>%
  add_markers()
wine %>% plot_ly(x = ~Flavanoids, y = ~Alcohol,
hoverinfo = "text",
text = ~paste("Flavanoids:", Flavanoids, "<br>", "Alcohol:", Alcohol)
) %>% add_markers()
~