Rで学ぶTree-Based ModelsによるMachine Learning
Sandro Raabe
Data Scientist
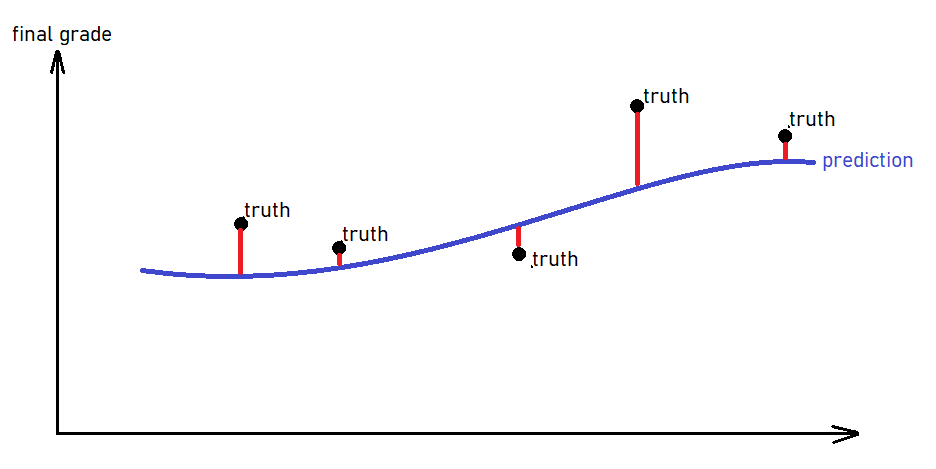
⇒ 予測が真値からどれだけ離れているかを測る
MAE = 赤い棒の平均の長さ
$$MAE = \frac{1}{n} \sum_{i=1}^n\left| actual_i - predicted_i \right|$$
$$\quad MSE = \quad \frac{1}{n} \sum_{i=1}^n\left( actual_i - predicted_i \right)^2$$
$$RMSE = \sqrt{\frac{1}{n} \sum_{i=1}^n\left( actual - predicted \right)^2}$$
# parsnip と yardstick は tidymodels に含まれる
library(tidymodels)
# 予測してテストデータに追加
predictions <- predict(model, new_data = chocolate_test) %>%

  bind_cols(chocolate_test)
# 予測してテストデータに追加 predictions <- predict(model, new_data = chocolate_test) %>%
bind_cols(chocolate_test)
# A tibble: 358 x 7
   .pred final_grade review_date cocoa_percent company_location
   <dbl>       <dbl>       <int>         <dbl> <fct>
 1  2.5         2.75        2013          0.7  France
 2  3.64        3.25        2014          0.8  France
 3  3.3         3.5         2012          0.7  France
 4  3.25        3.5         2011          0.72 Fiji
# ... with 354 more rows, and 2 more variables: bean_type <fct>, broad_bean_origin <fct>
# mae() で評価
mae(predictions,

    estimate = .pred,

    truth = final_grade)
# mae() で評価 mae(predictions,
estimate = .pred,
truth = final_grade)
# A tibble: 1 x 2
  .metric   .estimate
  <chr>         <dbl>
1 mae           0.363
# rmse() で評価
rmse(predictions,
     estimate = .pred,
     truth = final_grade)
# A tibble: 1 x 2
  .metric   .estimate
  <chr>         <dbl>
1 rmse          0.457