Rで学ぶTree-Based ModelsによるMachine Learning
Sandro Raabe
Data Scientist
noを常に予測する「単純」モデルでも正解率98%になり得る→ 負例が98%の不均衡データで起こりうる


predictions
# A tibble: 153 x 2
.pred_class true_class
<fct> <fct>
1 yes no
2 no no
3 no yes
4 yes yes
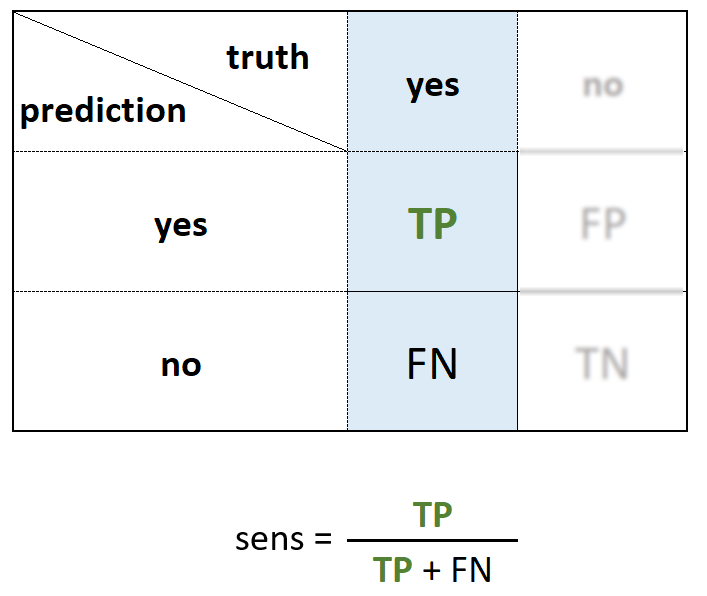
# 単一閾値の感度を計算
sens(predictions,
estimate = .pred_class,
truth = true_class)
# A tibble: 1 x 2
.metric .estimate
<chr> <dbl>
1 sensitivity 0.872
accuracy() と conf_mat() と同様の引数# テストデータで確率を予測 predictions <- predict(model, data_test,type = "prob") %>%bind_cols(data_test)
# A tibble: 9,116 x 13
.pred_yes still_customer age gender ...
<dbl> <fct> <int> <fct> ...
1 0.0557 no 45 M ...
2 0.0625 no 49 F ...
3 0.330 no 51 M ...
4 ...
...
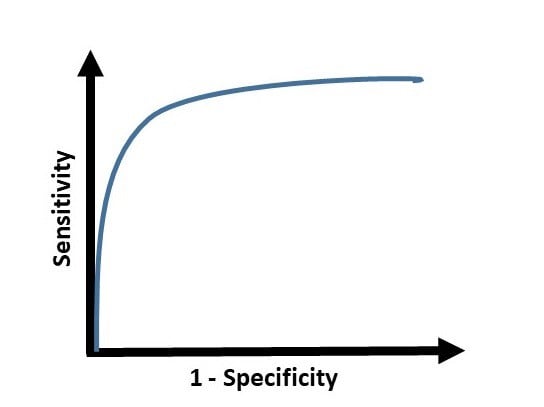
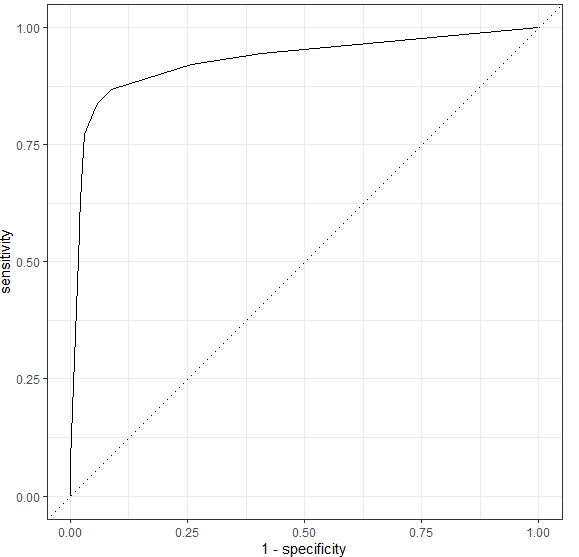
# 全閾値でROC曲線を計算 roc <- roc_curve(predictions,estimate = .pred_yes,truth = still_customer)# ROC曲線をプロット autoplot(roc)
# 曲線下面積を計算
roc_auc(predictions,
estimate = .pred_yes,
truth = still_customer)
# A tibble: 1 x 3
.metric .estimator .estimate
<chr> <chr> <dbl>
1 roc_auc binary 0.872
Rで学ぶTree-Based ModelsによるMachine Learning