データ品質チェックと要約統計

Pythonで学ぶ機械学習のモニタリング

Hakim Elakhrass

Co-founder and CEO of NannyML

データ品質チェックと要約統計とは?
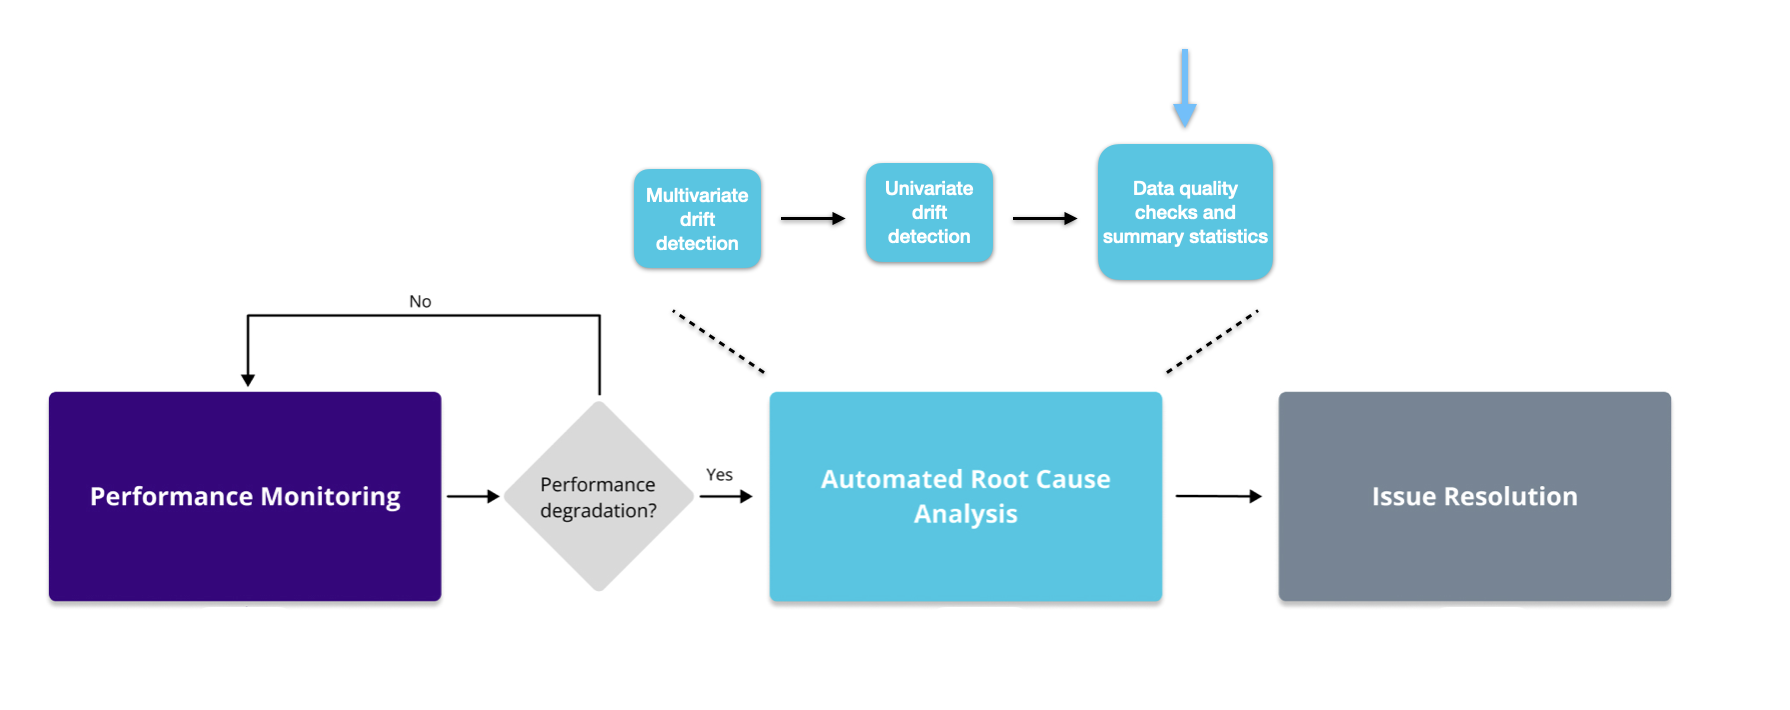
図: 監視ワークフローのうち、自動原因分析ステップの「データ品質チェック」と「要約統計」を強調表示

  • 欠損値の検出
  • 未出現値の検出
  • 合計・平均・標準偏差・中央値・行数
Pythonで学ぶ機械学習のモニタリング

欠損値の検出

  • チャンク内の観測数の減少
  • 有用情報の欠落
  • 誤った解釈や意思決定
# Instantiate the missing values calculator module
ms_calc = nannyml.MissingValuesCalculator(column_names=["Age"], normalize=True)

# Fit the calculator on the reference set
ms_calc.fit(reference)

# Calculate the rate of the missing values on the analysis set
ms_results = ms_calc.calculate(analysis)
ms_results.plot()
Pythonで学ぶ機械学習のモニタリング

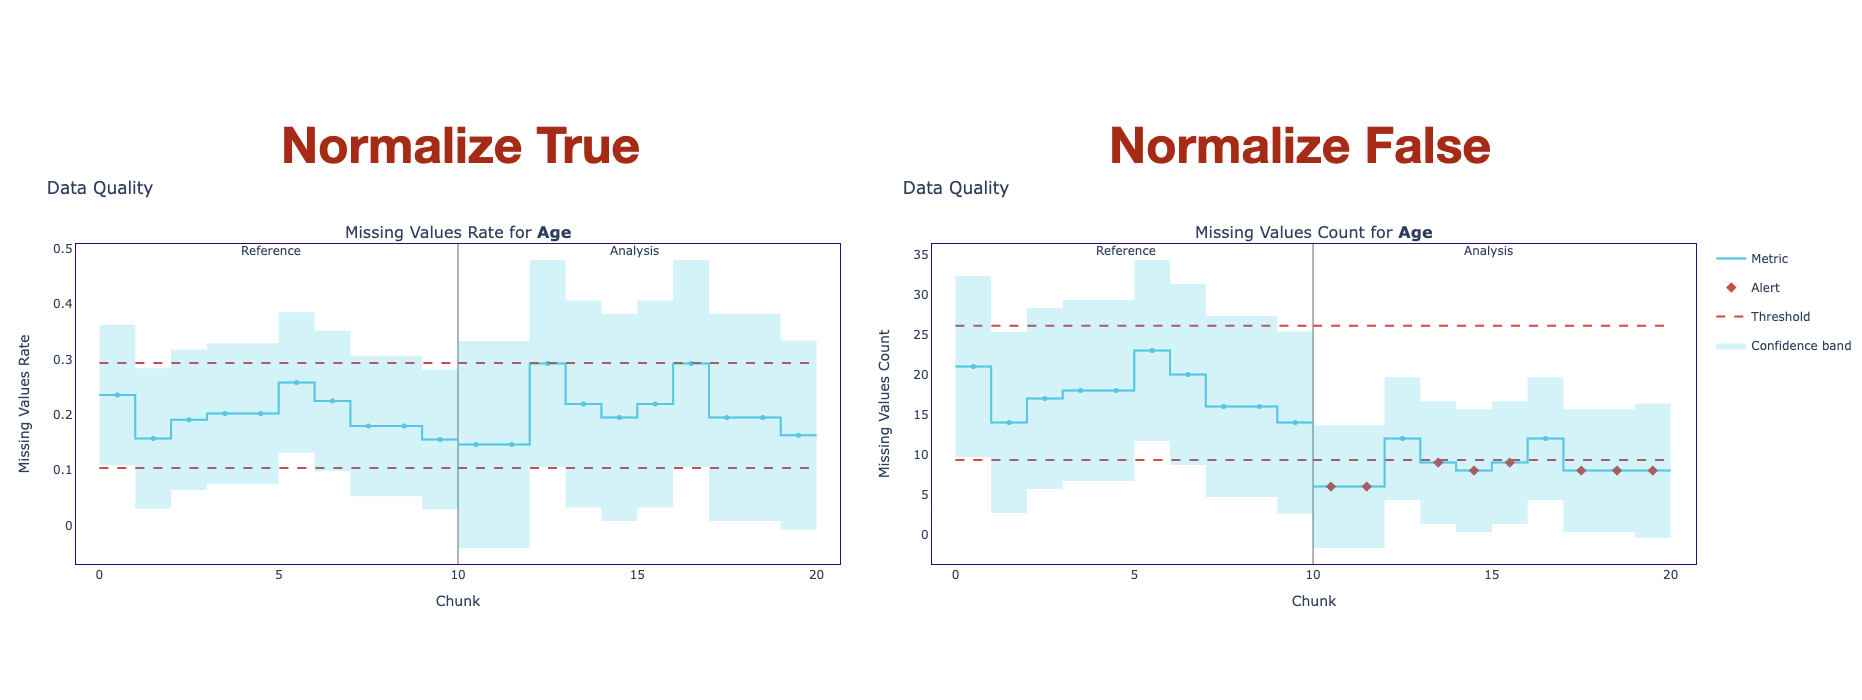
欠損値のプロット

グラフ: normalize を True/False にした場合の欠損値結果の比較

Pythonで学ぶ機械学習のモニタリング

未出現値の検出

  • 参照期間に存在しないカテゴリ値
  • 未出現値の増加は、特定領域でモデルの信頼度を下げうる
# Instantiate the unseen values calculator module
us_calc = nannyml.UnseenValuesCalculator(column_names=["Cabin"], normalize=False)
# Fit, calculate and plot the rate of the unseen values
us_calc.fit(reference)
us_results = us_calc.calculate(analysis)
us_results.plot()
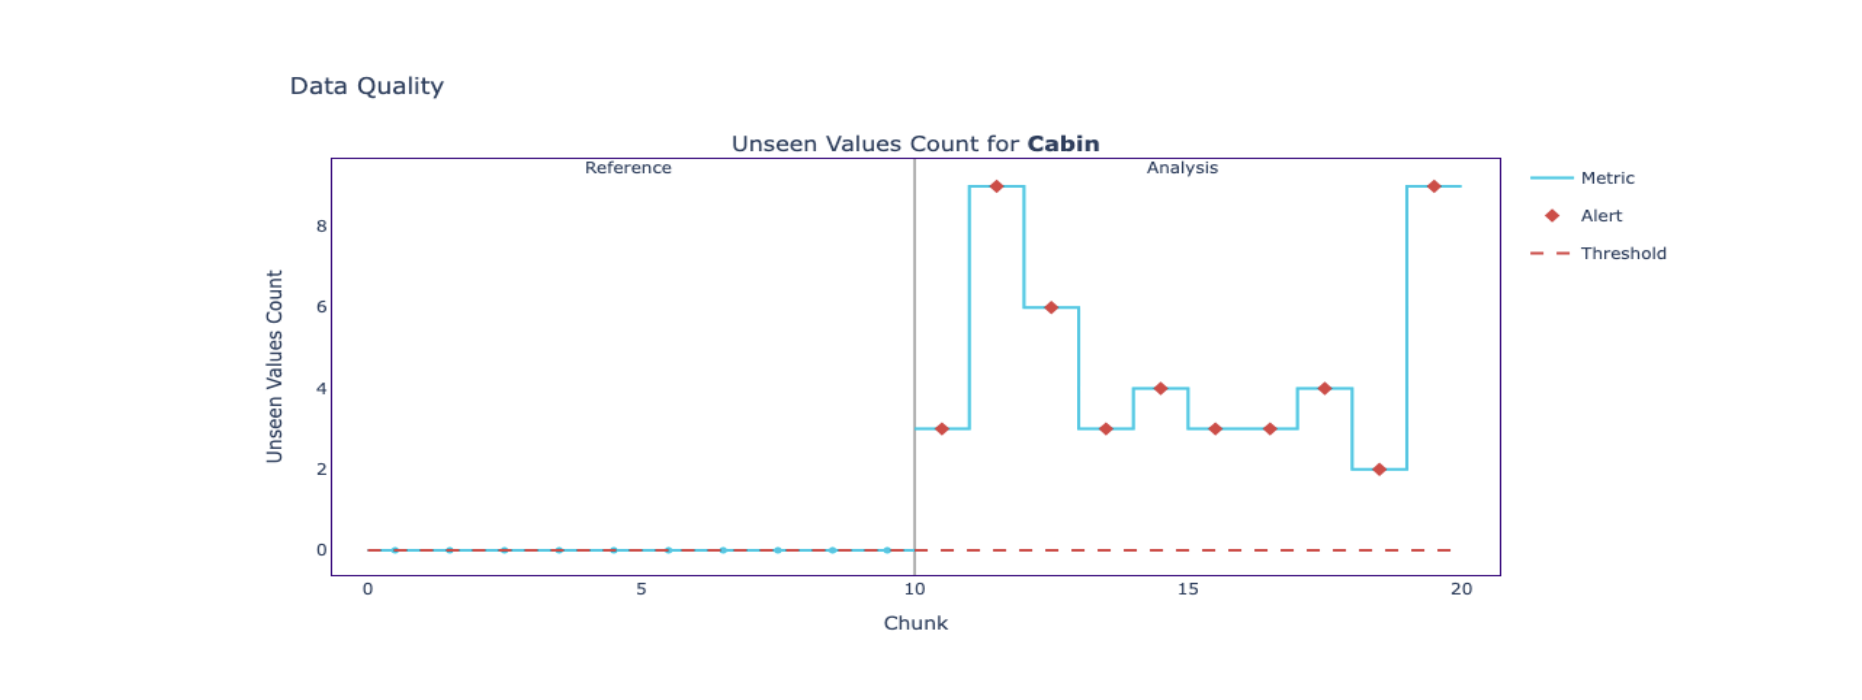
図: 未出現値のプロット。未出現値数の変化を表示

Pythonで学ぶ機械学習のモニタリング

要約統計

  • 合計: 期間別の売上や利益など、財務データに有用。
  • 平均標準偏差: データドリフト検知や説明性に役立つ。
  • 中央値: 外れ値に強く、極端値が多い特徴量に有用。
  • 行数: 各チャンクのデータ量を確認。
sum_calc = nannyml.SummaryStatsSumCalculator(column_names=selected_columns)
avg_calc = nannyml.SummaryStatsAvgCalculator(column_names=selected_columns)
std_calc = nannyml.SummaryStatsStdCalculator(column_names=selected_columns)
med_calc = nannyml.SummaryStatsMedianCalculator(column_names=selected_columns)
rows_calc = nannyml.SummaryStatsRowCountCalculator(column_names=selected_columns)
Pythonで学ぶ機械学習のモニタリング

練習しましょう!

Pythonで学ぶ機械学習のモニタリング

Preparing Video For Download...