単変量ドリフト検知

Pythonで学ぶ機械学習のモニタリング

Hakim Elakhrass

CEO and co-founder

単変量ドリフト検知とは?
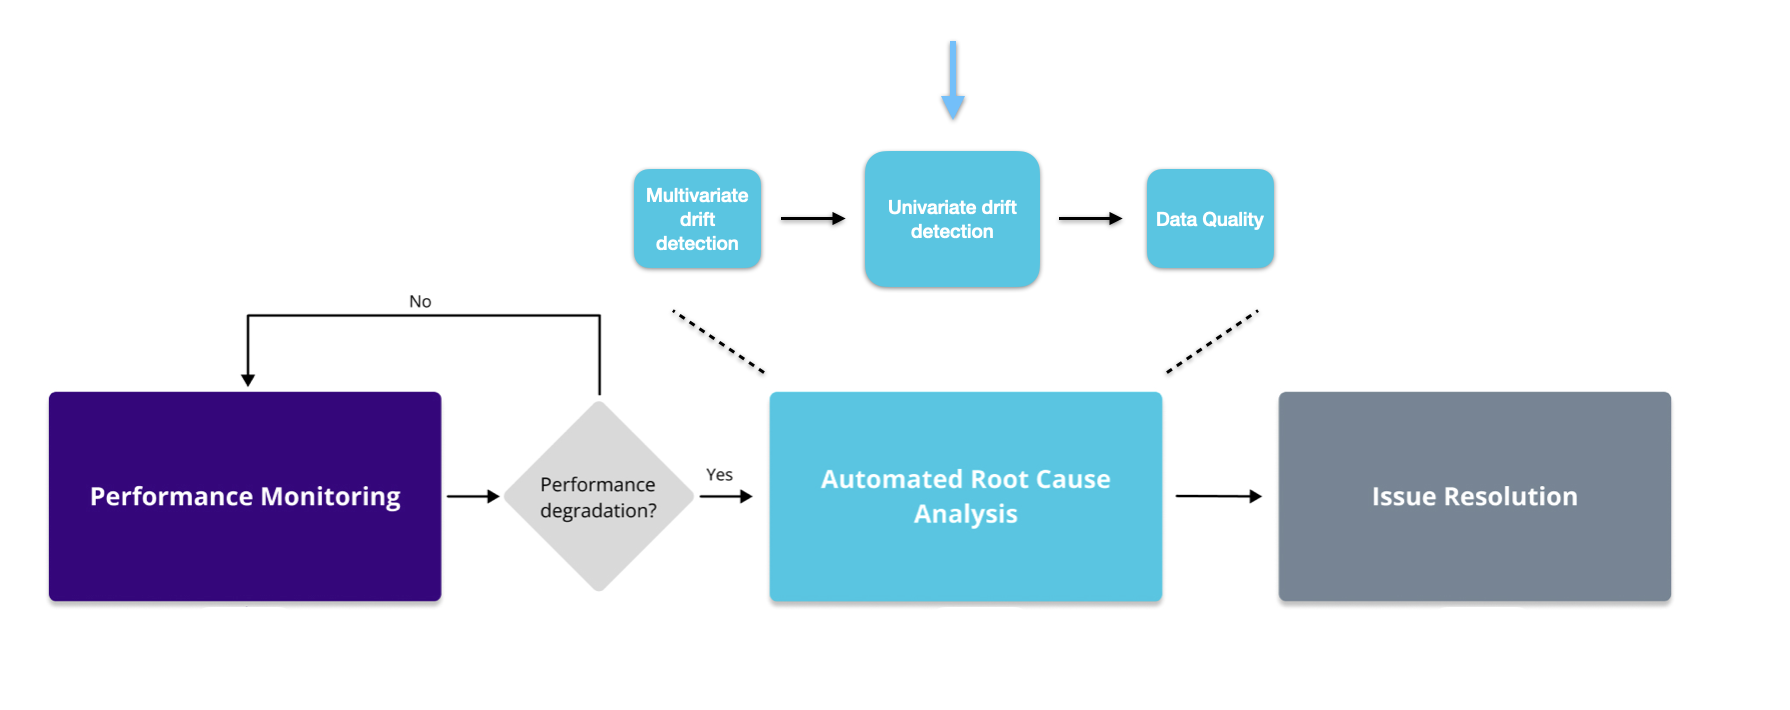
画像はモニタリングのワークフローと単変量手法の位置付けを示します。

Pythonで学ぶ機械学習のモニタリング

単変量手法

  • Jensen-Shannen 距離 - カテゴリ・連続の両方
  • Hellinger - カテゴリと連続
  • Wasserstein - 連続のみ
  • Kolgomorov-Smirnov - 連続のみ

  • L-infinity - カテゴリのみ

  • カイ二乗 (Chi2) - カテゴリのみ

1 https://nannyml.readthedocs.io/en/stable/how_it_works/univariate_drift_comparison.html
Pythonで学ぶ機械学習のモニタリング

コード実装

# Intialize the univariate drift calculator
uv_calc = nannyml.UnivariateDriftCalculator(
    continuous_methods=['wasserstein', 'hellinger'],
    categorical_methods=['jensen_shannon', 'l_infinity', 'chi2'],
    column_names=feature_column_names,
    timestamp_column_name='timestamp',
    chunk_period='d'
    )
# Fit, calculate and plot the results
uv_calc.fit(reference)
uv_results = uv_calc.calculate(analysis)
uv_results.plot().show()
Pythonで学ぶ機械学習のモニタリング

フィルタリング

  • 列名でフィルタ
  • 単変量手法でフィルタ
# Filter the univariate results
filtered_figure = uv_results.filter(column_names=['trip_distance', 'fare_amount'], 
            methods=['jensen_shannon'])

# Plot the filtered results
filtered_figure.show().plot()
Pythonで学ぶ機械学習のモニタリング

アラート数ランカー

  • アラート数で特徴量をランク付け
# Initialize the alert count ranker
alert_count_ranker = nannyml.AlertCountRanker()
alert_count_ranked_results = alert_count_ranker.rank(
    uv_results,
    only_drifting=False)
# Display the results
display(alert_count_ranked_results)
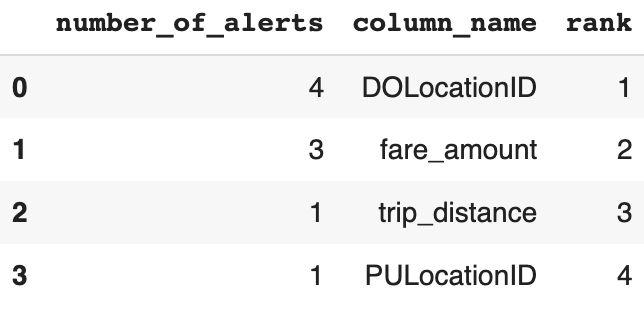
画像は各特徴量のアラート数を示すデータフレームです。

Pythonで学ぶ機械学習のモニタリング

相関ランカー

  • 性能の絶対変化との相関の強さで特徴量をランク付け
# Initialize the correlation ranker
correlation_ranker = nannyml.CorrelationRanker()
correlation_ranker.fit(perf_results.filter(period='reference'))
correlation_ranked_results = correlation_ranker.rank(uv_results, perf_results)

# Display the results
display(correlation_ranked_results)
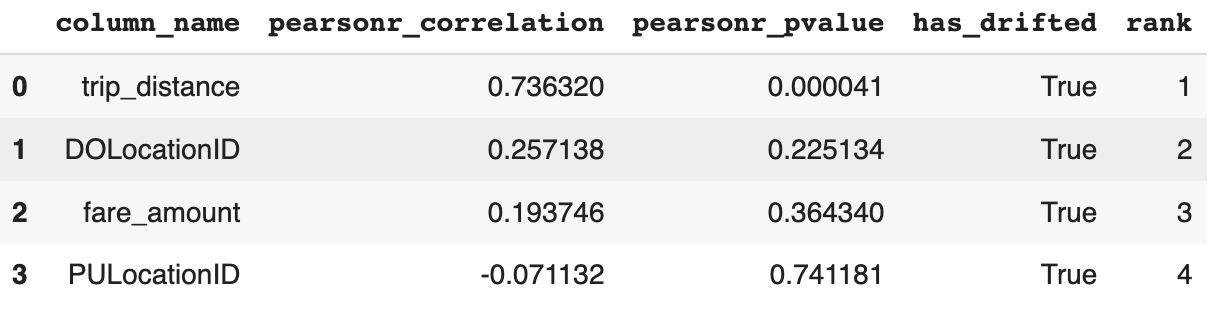
画像は各特徴量のピアソン相関とp値を示すデータフレームです。

Pythonで学ぶ機械学習のモニタリング

特徴量分布のモニタリング

  • 洞察を深め、説明性を向上
# Create distribution plots
distribution_results = uv_results.plot(kind='distribution')

# Show the plots
distribution_results.show()
Pythonで学ぶ機械学習のモニタリング

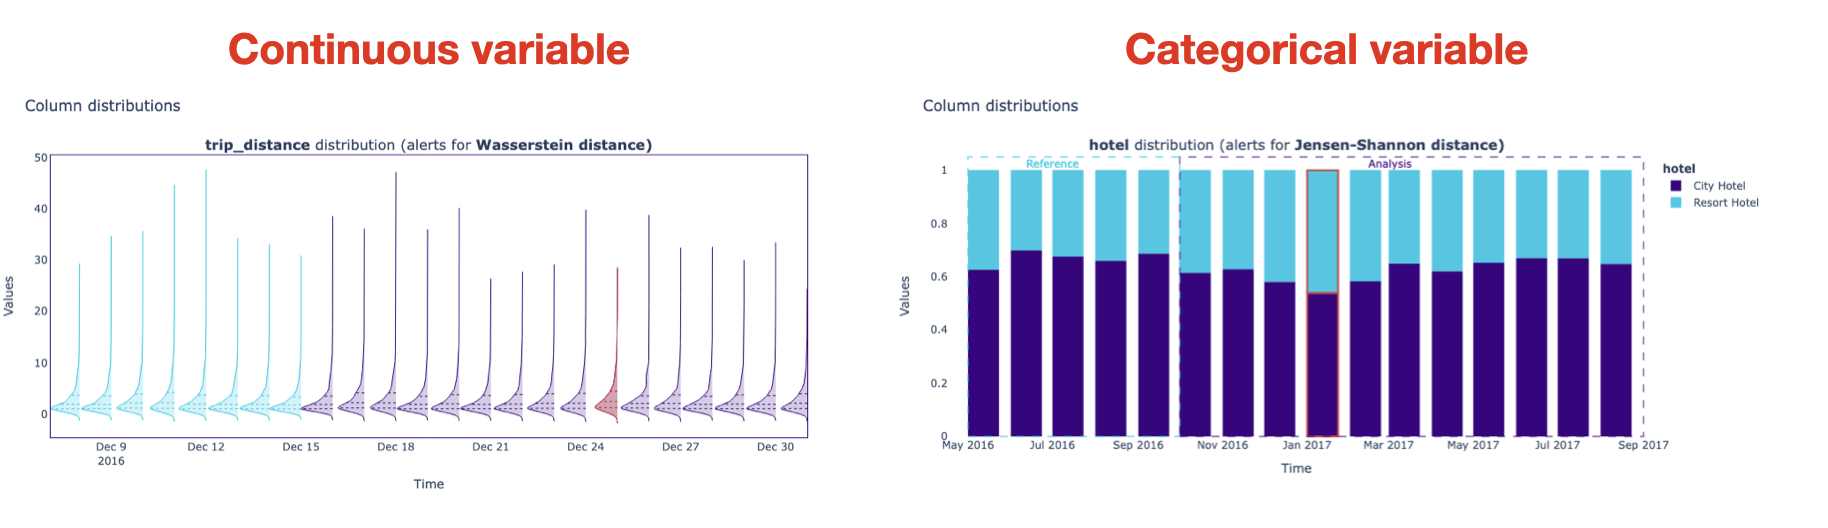
特徴量分布プロット


画像は連続・カテゴリ特徴量の分布プロットを示します。

Pythonで学ぶ機械学習のモニタリング

練習しましょう!

Pythonで学ぶ機械学習のモニタリング

Preparing Video For Download...