shinydashboard で作るダッシュボード
Png Kee Seng
Researcher
ロンドンの旅行代理店に勤務しています。
旅行者には宿泊先が必要です。
私たちは何ができるでしょうか。


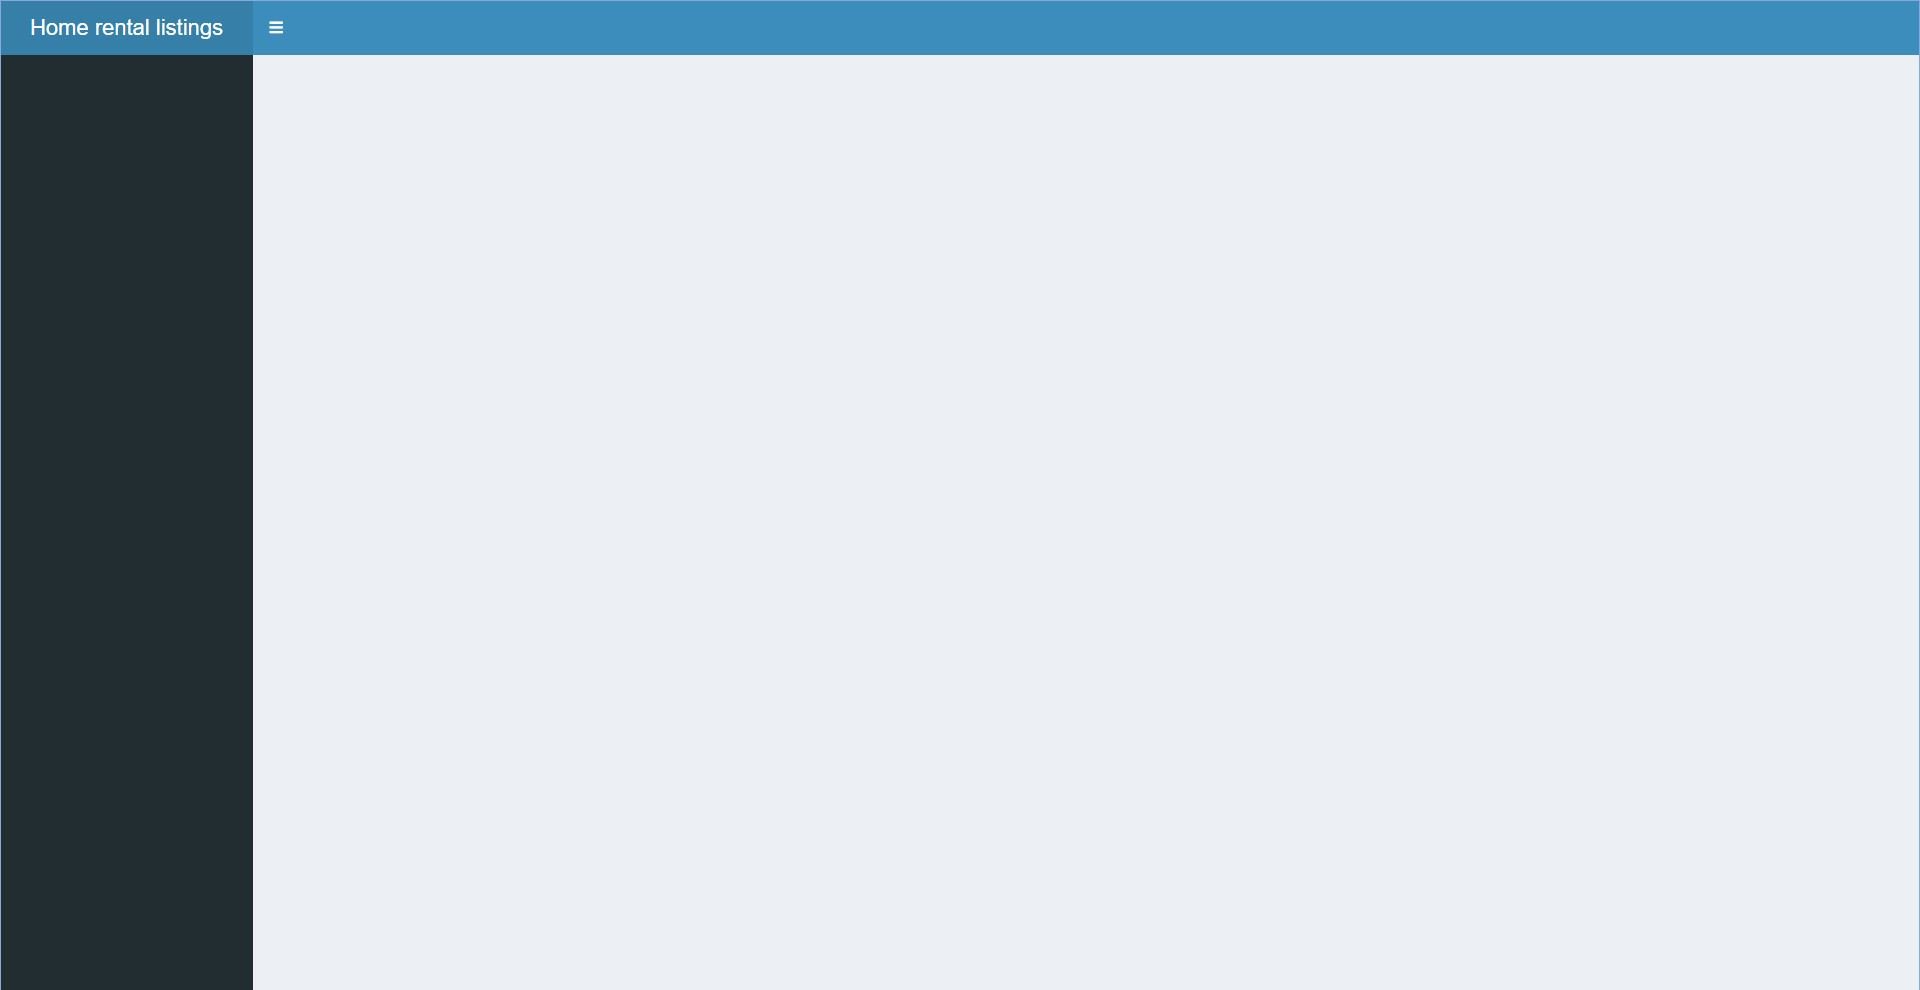
header <- dashboardHeader(
title = "Home rental listings")
sidebar <- dashboardSidebar()
body <- dashboardBody()
ui <- dashboardPage(header,
sidebar,
body)
server <- function(input, output) {}
shinyApp(ui, server)
body で:
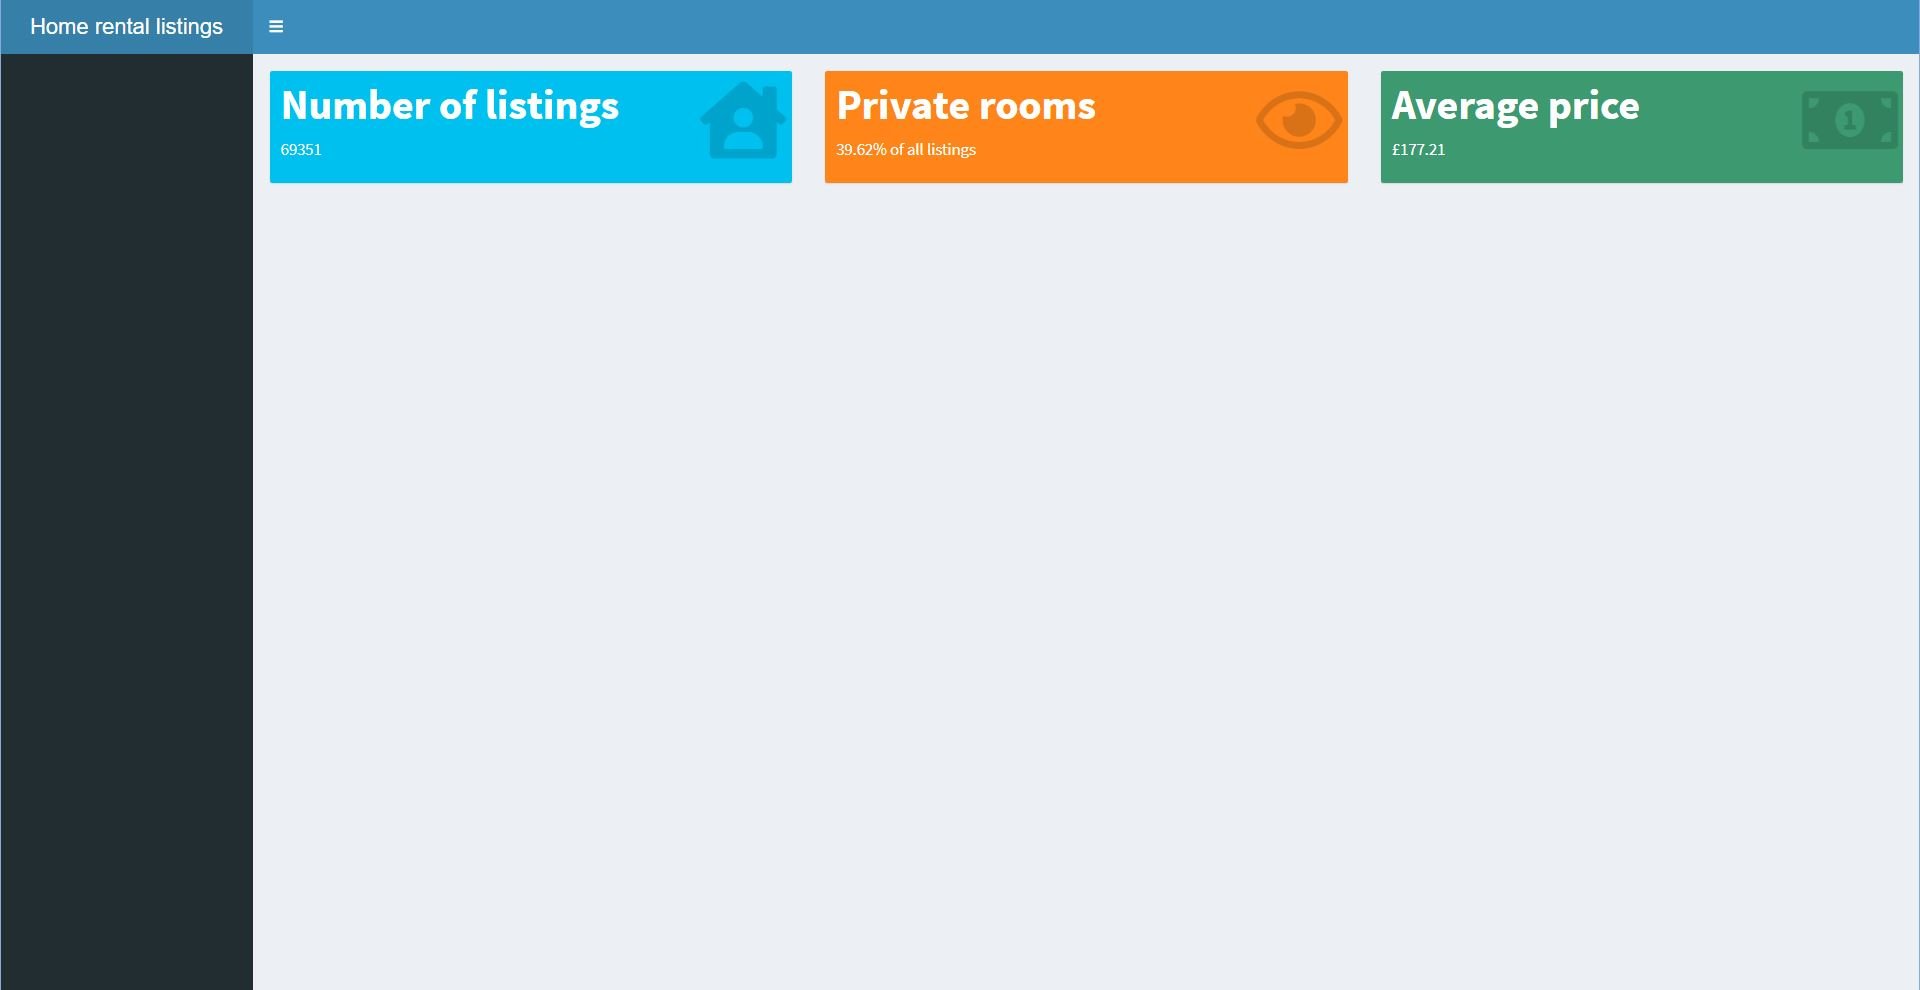
fluidRow(
valueBoxOutput(outputId = "count"),
valueBoxOutput(outputId = "prop"),
valueBoxOutput(outputId = "avg"))
server で:
output$count <- renderValueBox({
valueBox(..., icon = ...)})
output$prop <- renderValueBox(...)
...
body で:
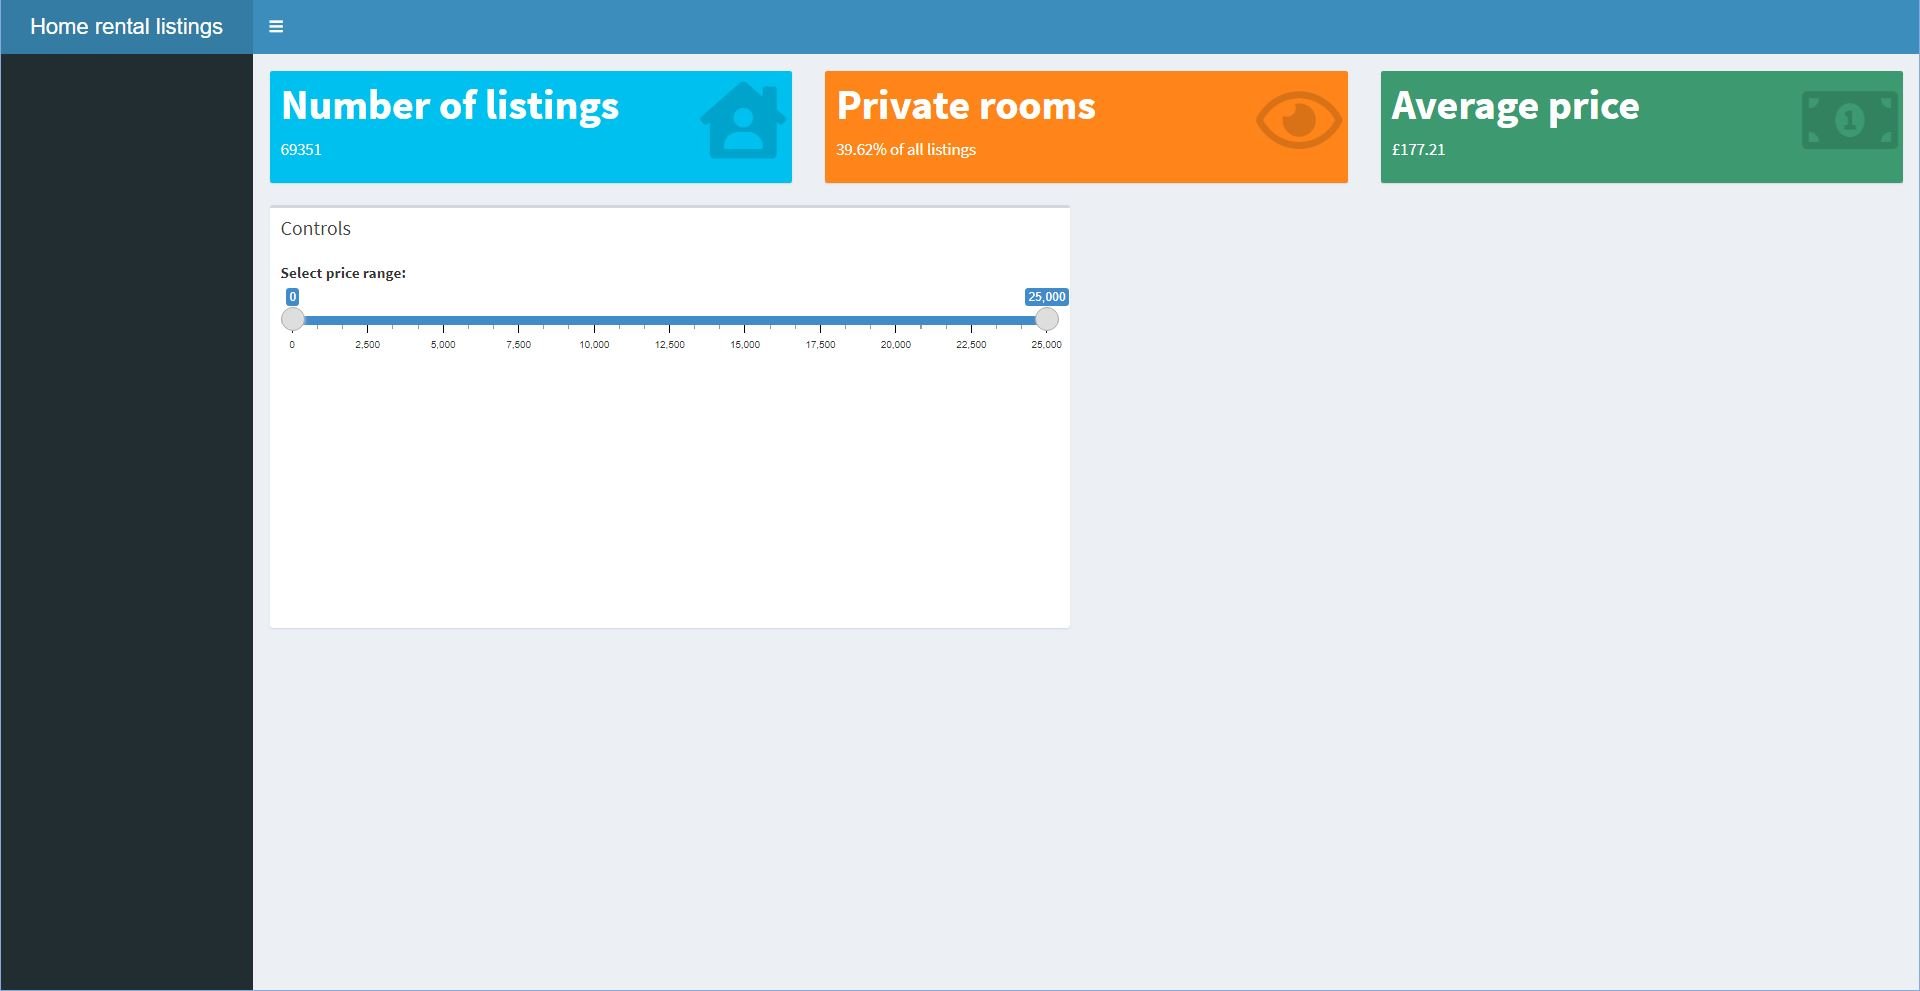
box(
side = "right", ...,
sliderInput(inputId = "range",
label = "価格帯を選択:",
min = 0,
max = 25000,
value = c(0,25000))
))
server を更新し、input$range[1] と input$range[2] を使用

body で:
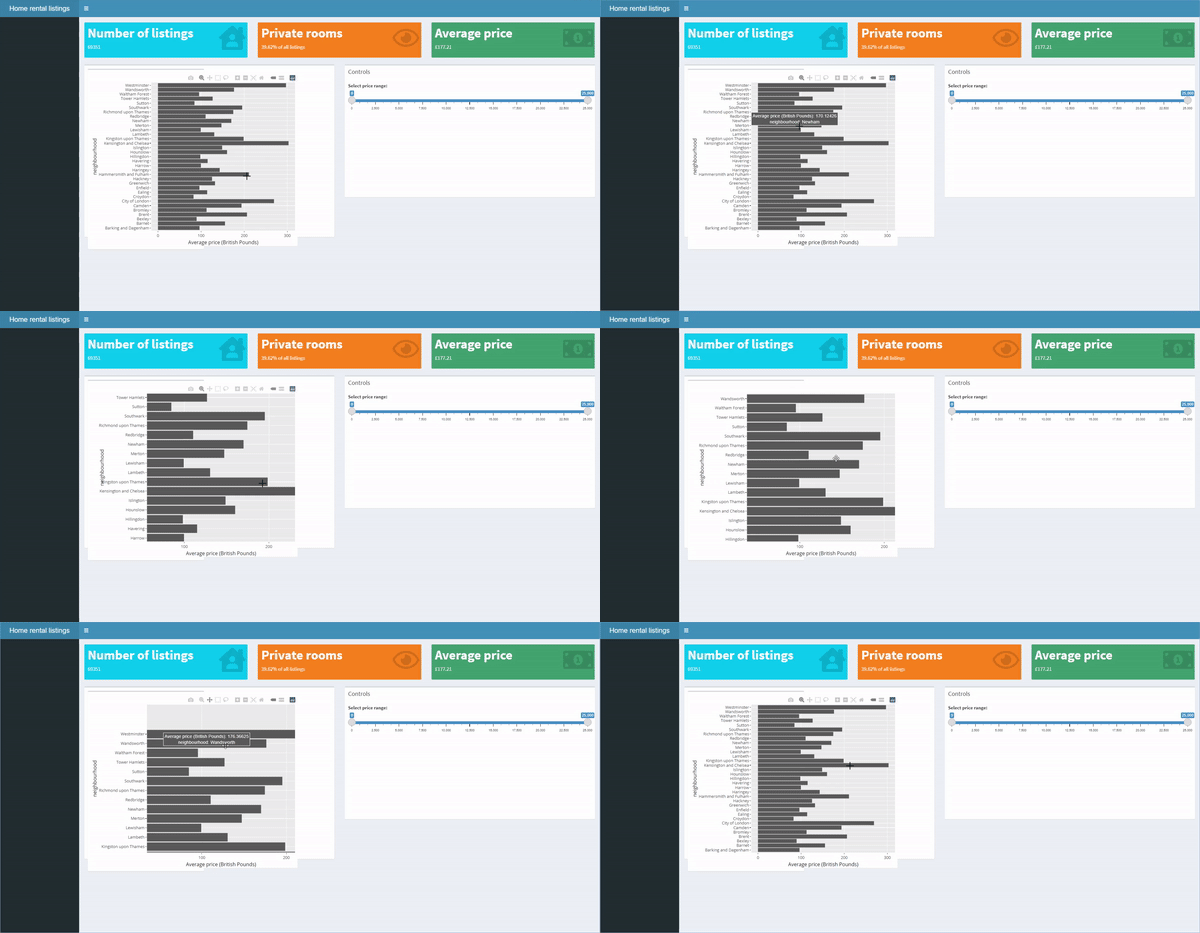
plotlyOutput("plots",
height = 500,
width = 600)
server で:
output$plots <- renderPlotly({
...
})

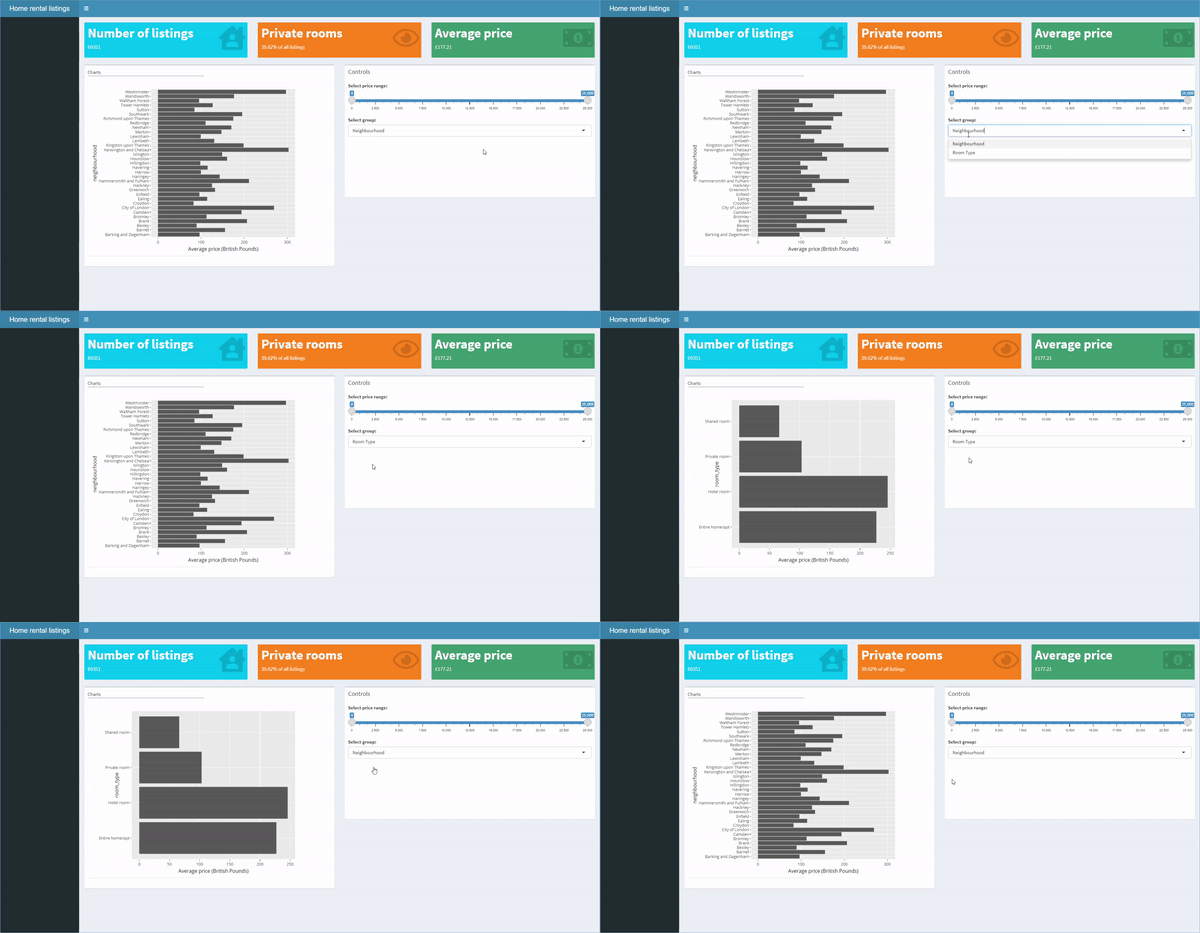
body で:
selectInput(inputId = "select",
label = "グループを選択:",
choices = c("Neighbourhood",
"Room Type"))
server で:
output$plots <- renderPlotly({
if (input$select == ...){plot1}
else if(input$select == ...){plot2}
})
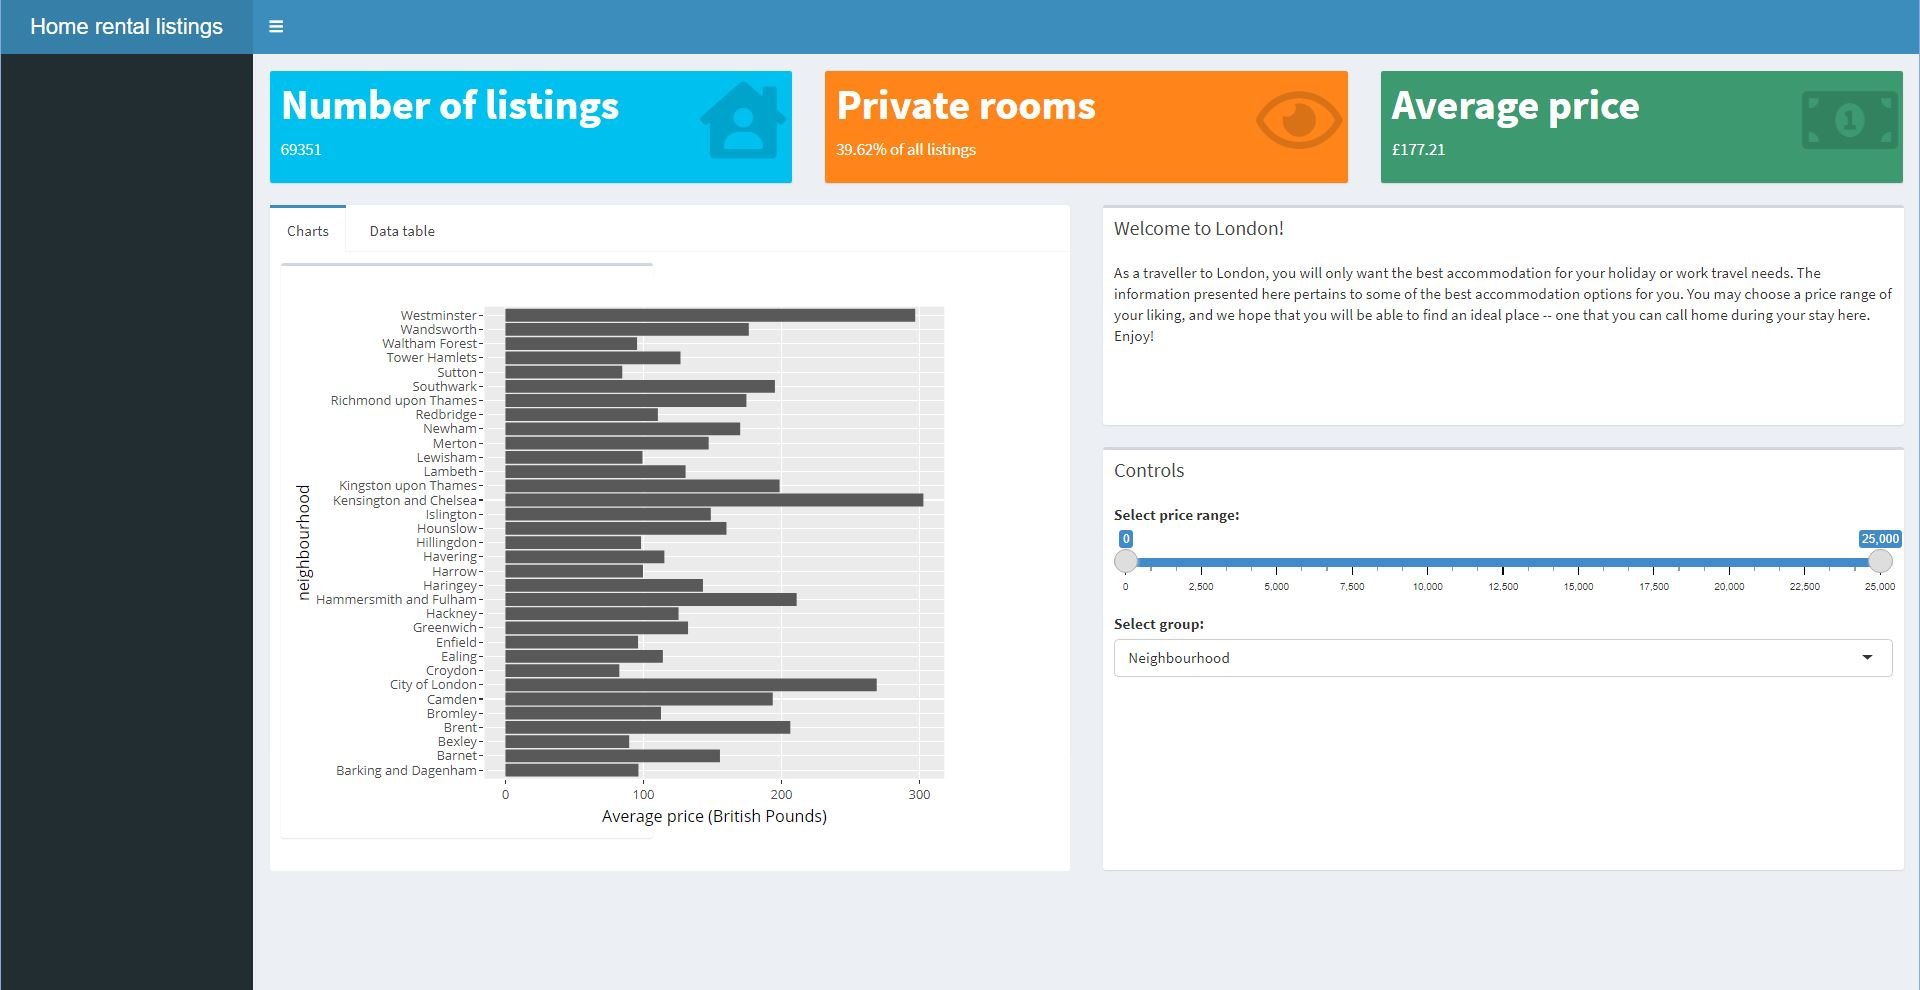
body で:
box(side = "right", ...,
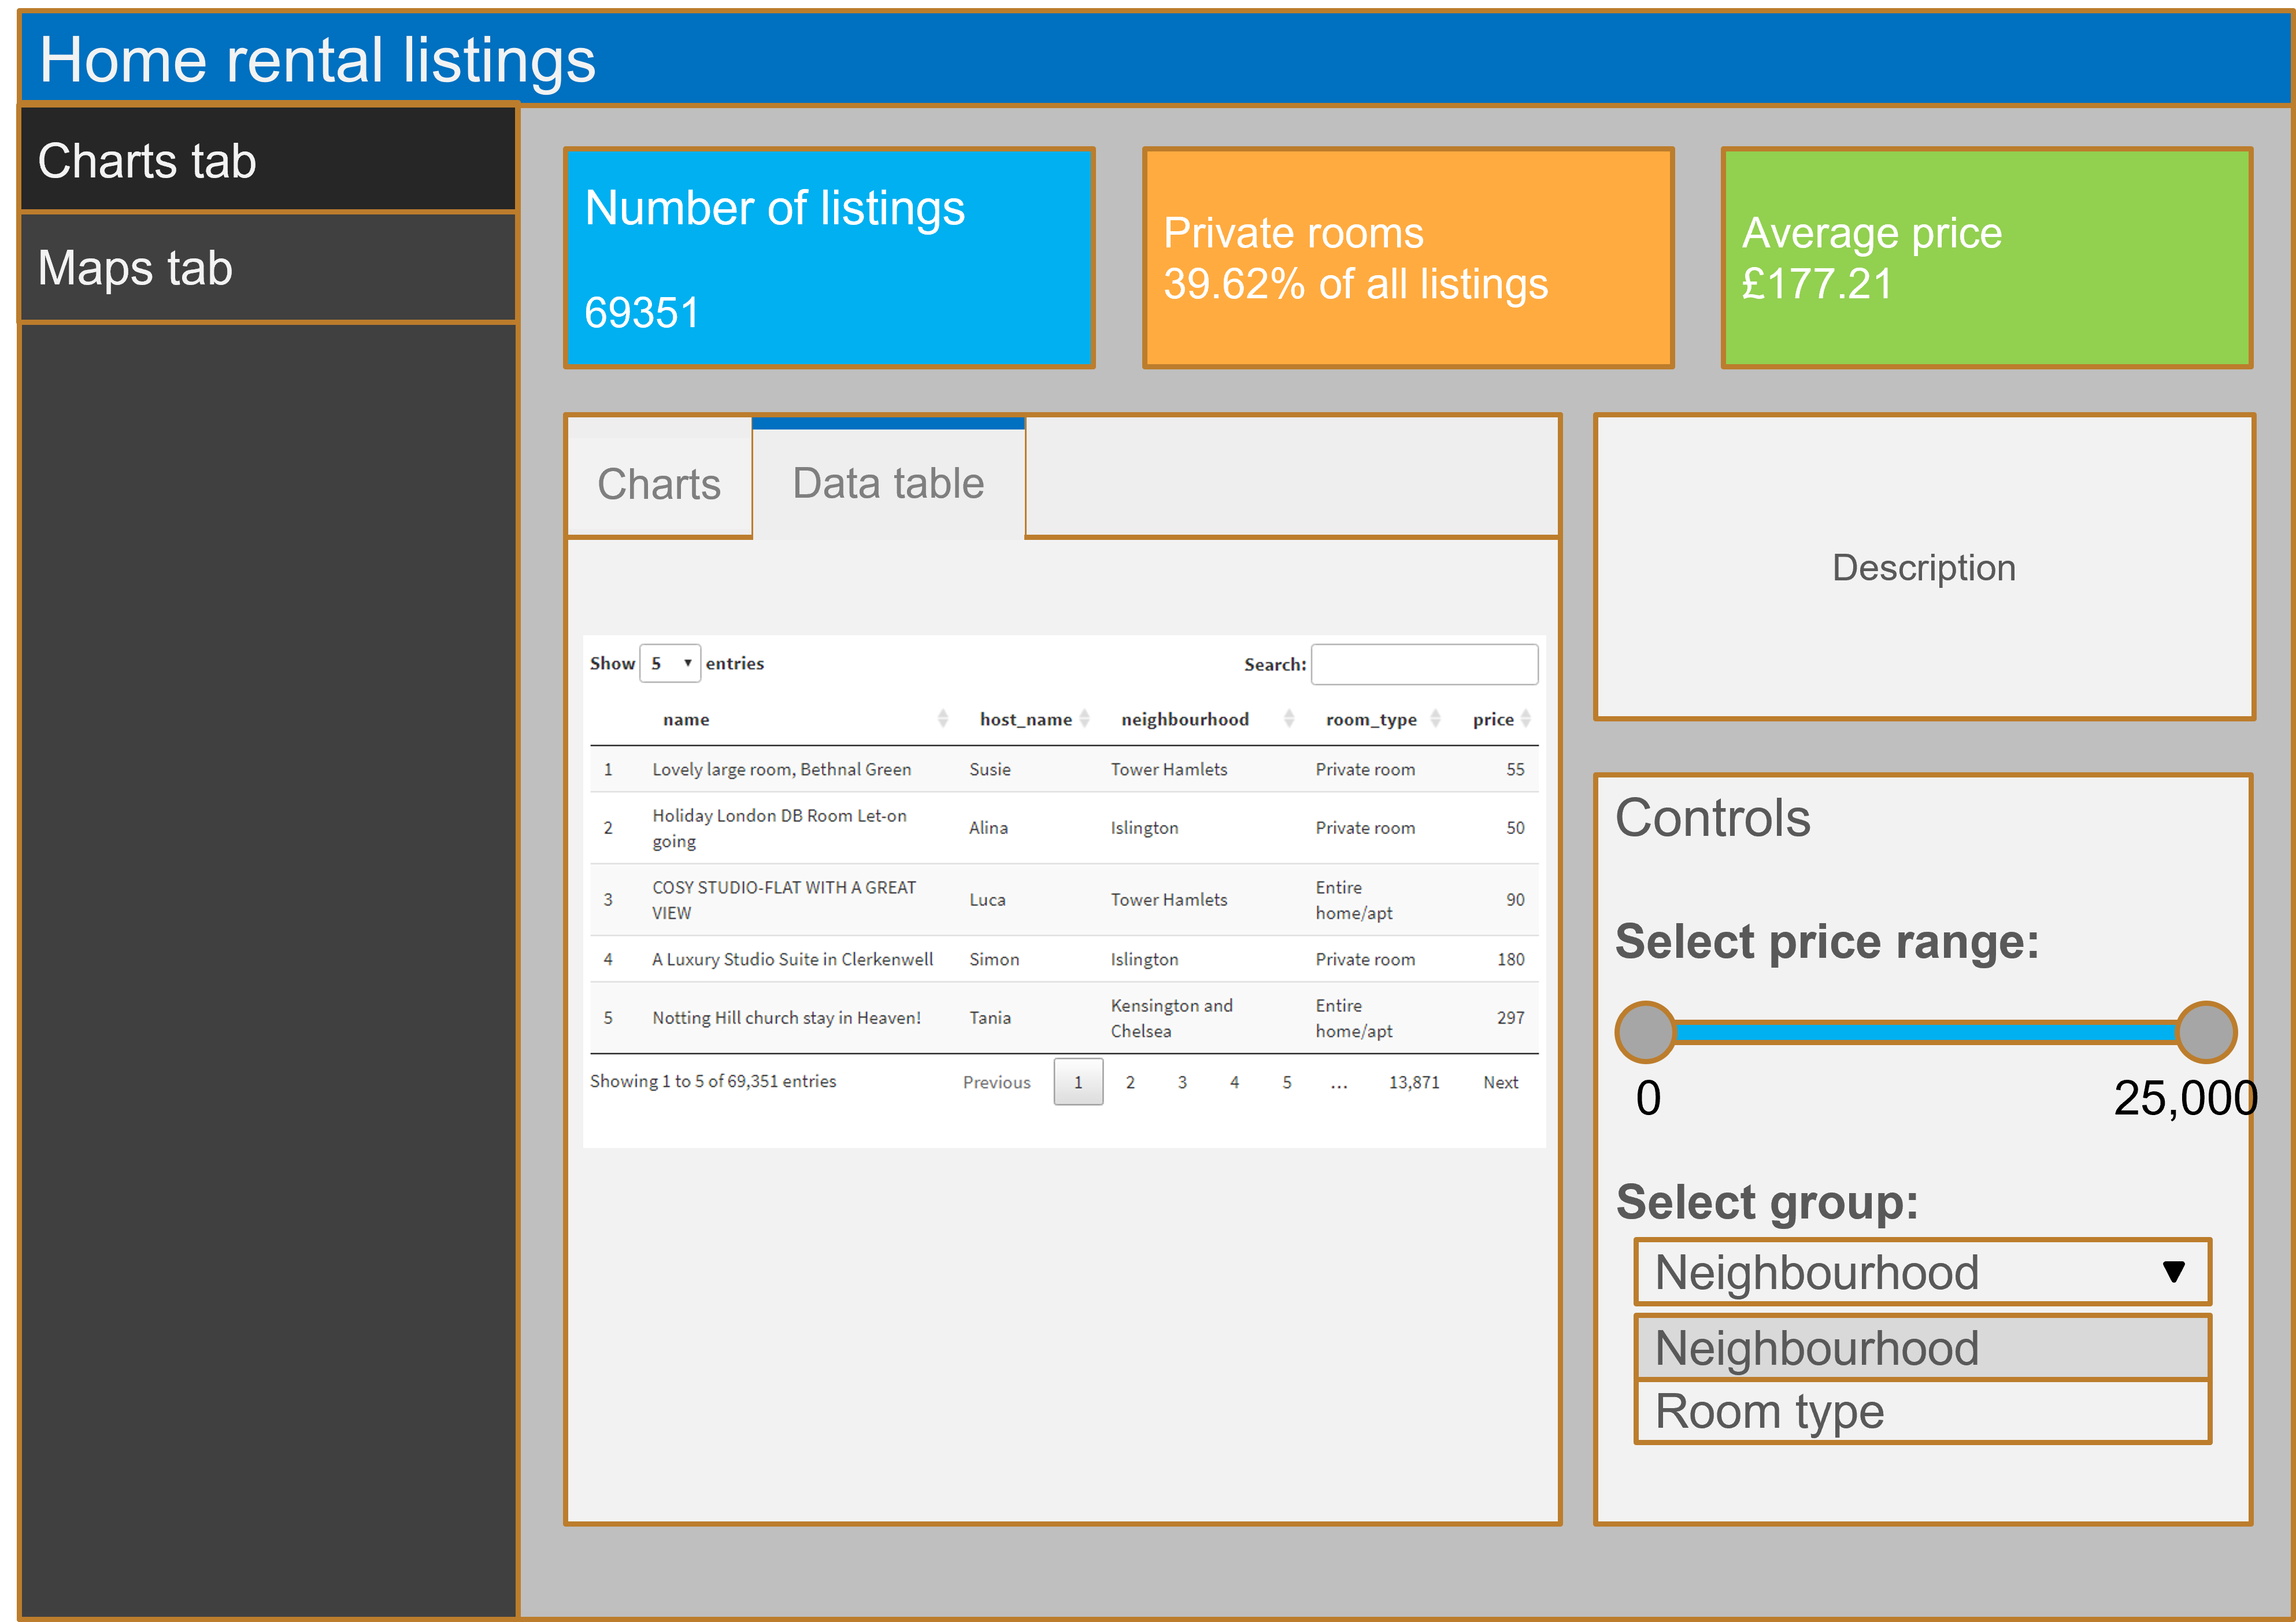
title = "ロンドンへようこそ!",
"...")
body を更新:
tabBox(id = "tabset", ...,
tabPanel("Charts", ...),
tabPanel("Data table", ...)

shiny の関数を使えます。
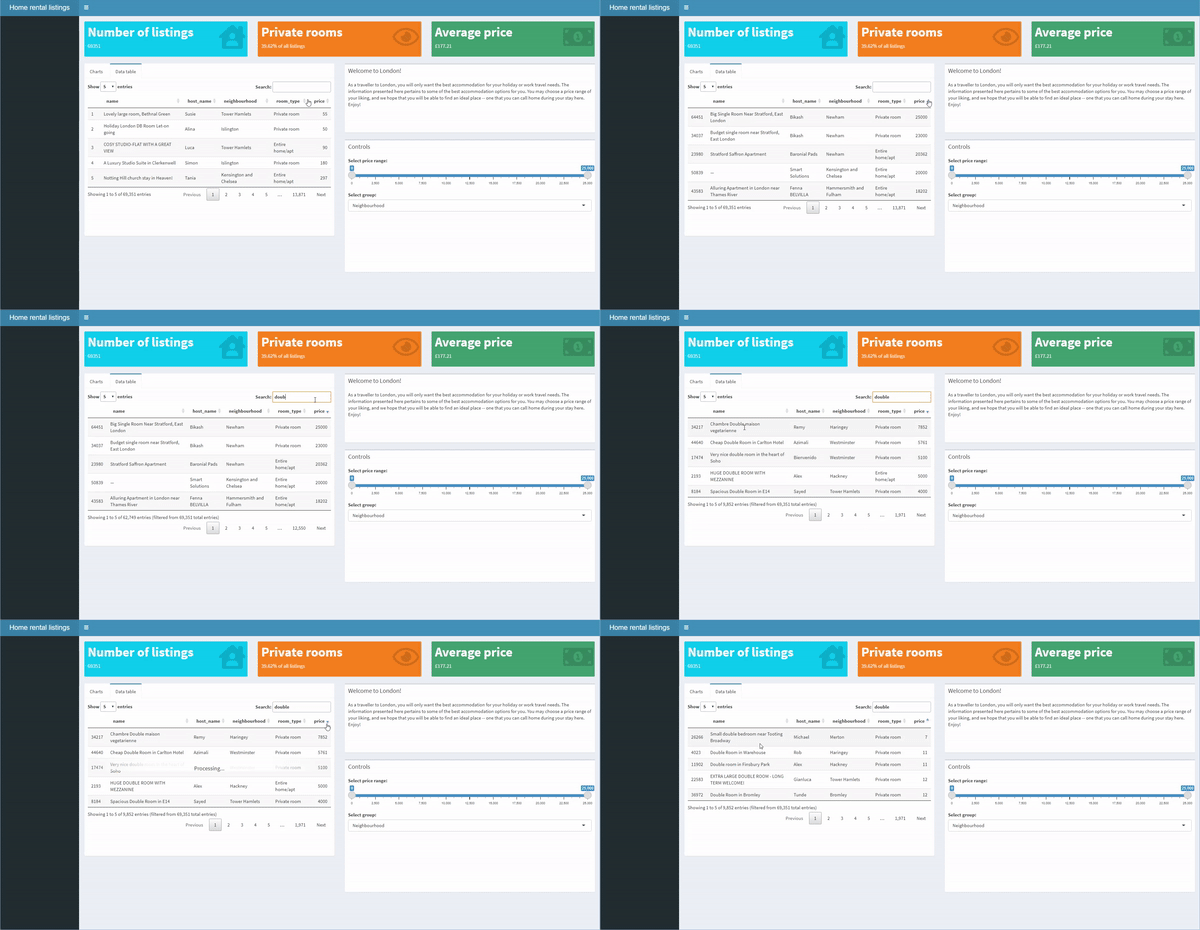
body で:
dataTableOutput("table")
server で:
output$table <-
renderDataTable(listings)

sidebar で:
sidebarMenu(
menuItem("Charts", ...),
menuItem("Map", ...))
body で:
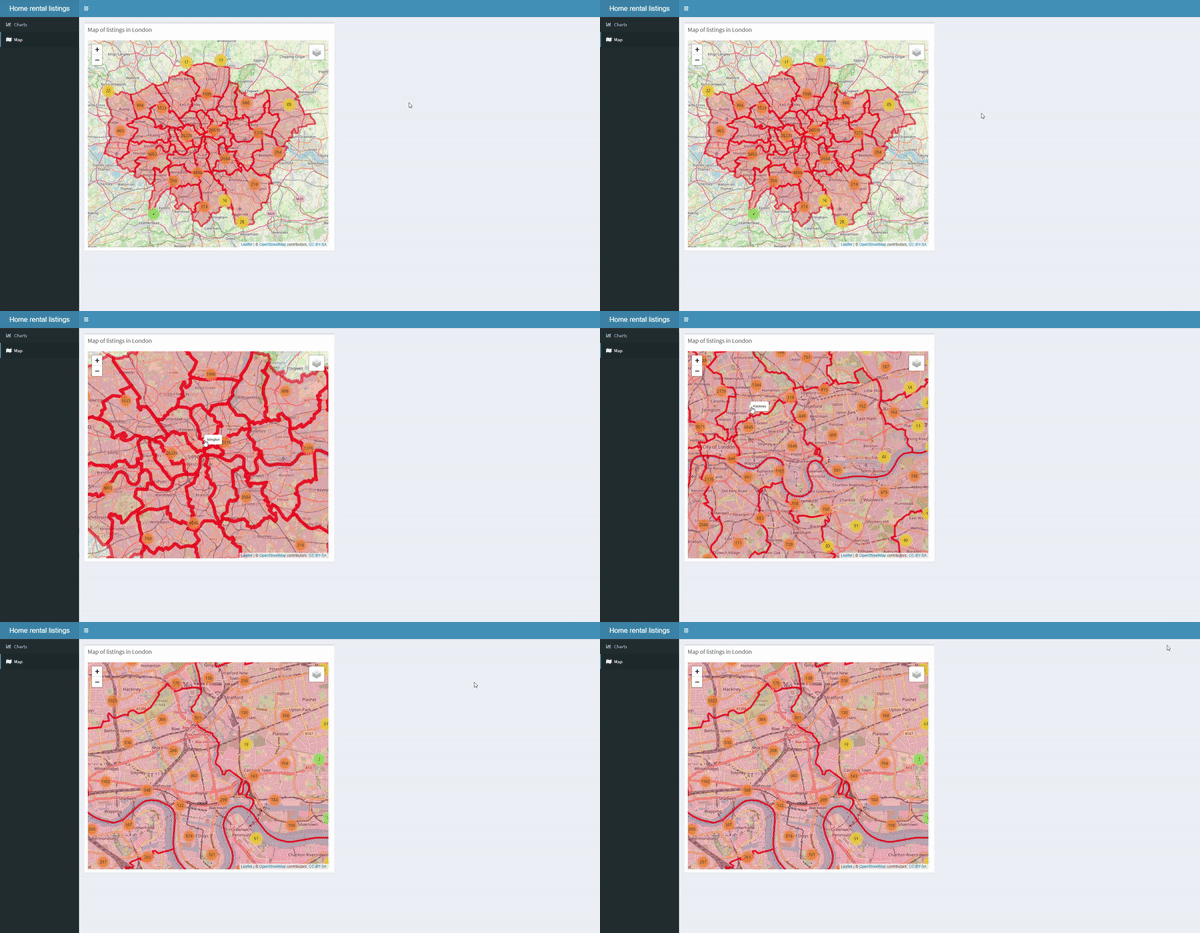
leafletOutput("map",...)
server で:
output$map <- renderLeaflet(map)
shinydashboard で作るダッシュボード