shinydashboard で作るダッシュボード
Png Kee Seng
Researcher
dashboardBody() で定義し、慣例的に body に保存body <- dashboardBody(...)

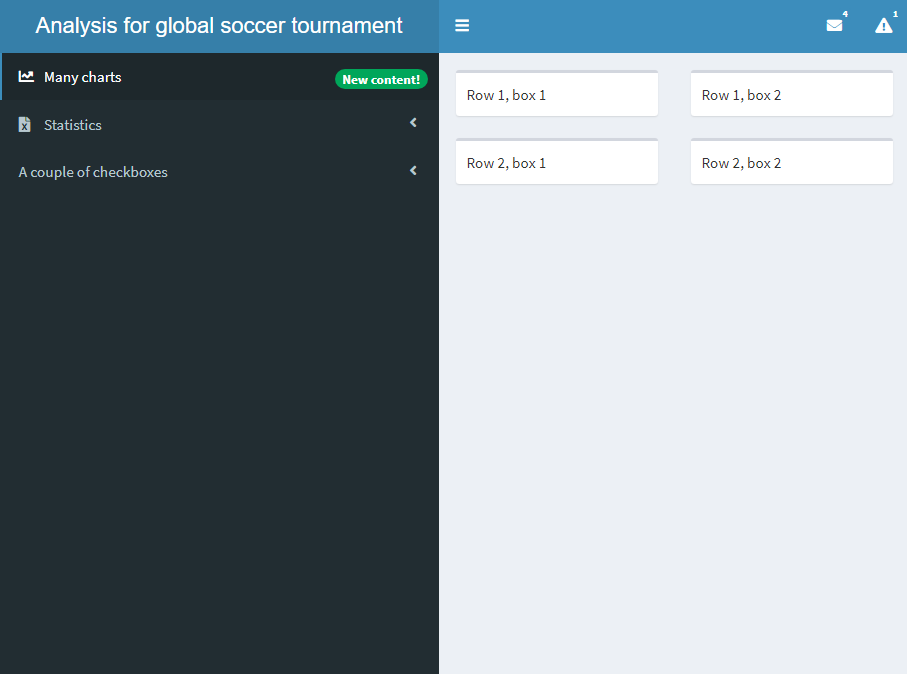
fluidRow() で行を追加box() でボックスを追加
body <- dashboardBody(fluidRow(box("Row 1, box 1"), box("Row 1, box 2")), fluidRow(box("Row 2, box 1"), box("Row 2, box 2")))

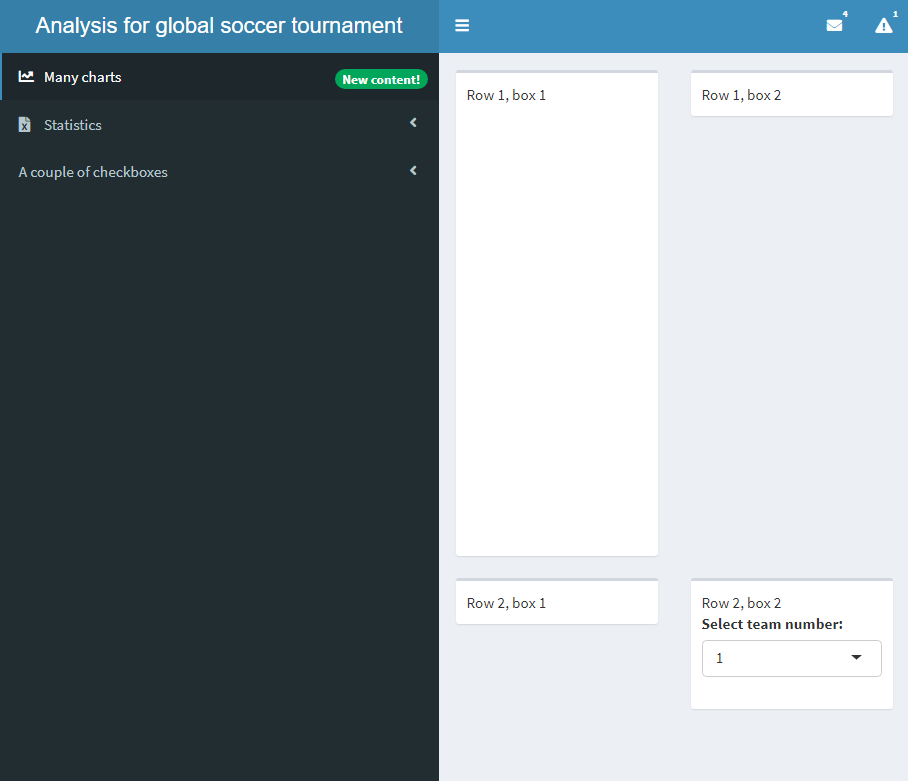
body <- dashboardBody( fluidRow(box("Row 1, box 1",plotOutput('plot')),box("Row 1, box 2")), fluidRow(box("Row 2, box 1"), box("Row 2, box 2",selectInput("select", "Select team number:", choices = c(1,2)))))
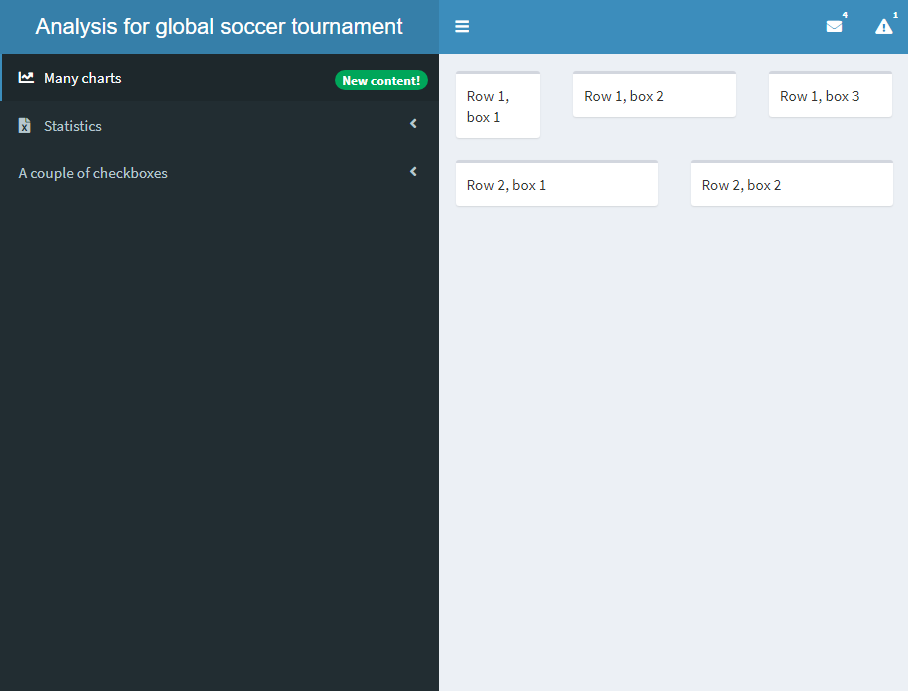
width を指定box() を追加する設計が推奨
body <- dashboardBody(
fluidRow(box("Row 1, box 1"),
box("Row 1, box 2"),
box("Row 1, box 3")),
fluidRow(box("Row 2, box 1"),
box("Row 2, box 2"))
)
body <- dashboardBody(
fluidRow(box("Row 1, box 1", width = 3),
box("Row 1, box 2", width = 5),
box("Row 1, box 3", width = 4)),
fluidRow(box("Row 2, box 1"),
box("Row 2, box 2"))
)
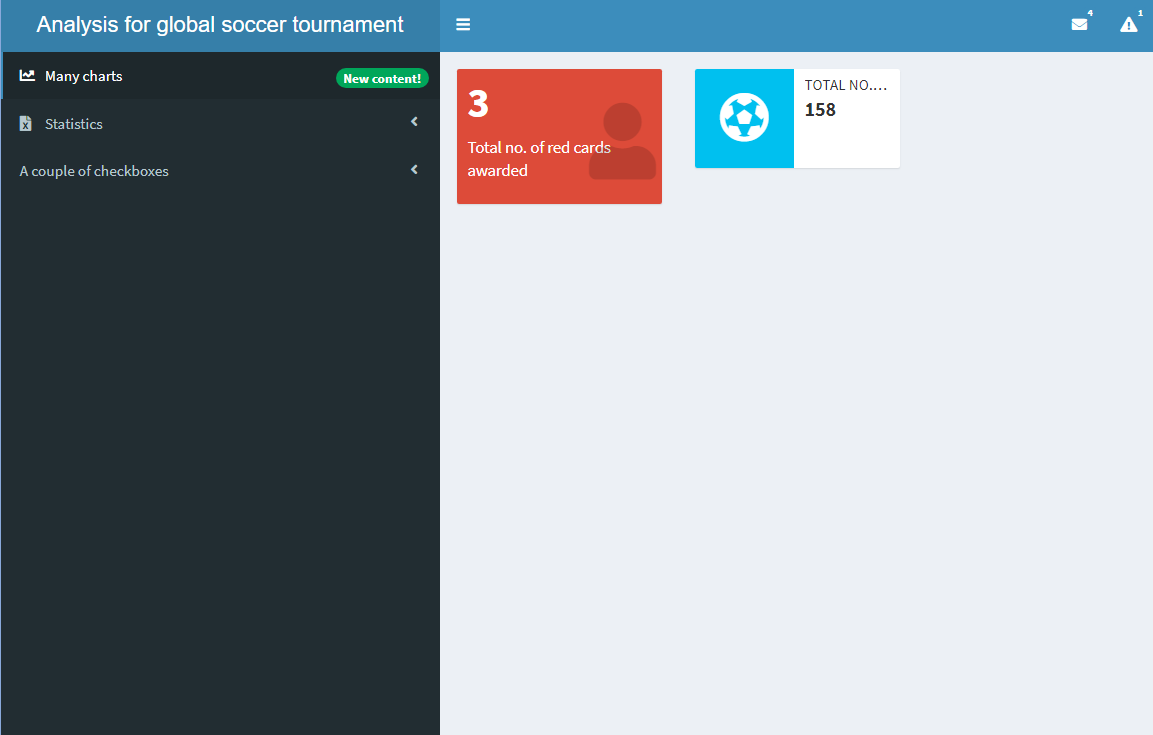
valueBox()infoBox()
body <- dashboardBody( fluidRow(valueBox(value = 3, subtitle = "Total no. of red cards awarded", icon = icon("user"), color = "red"),infoBox(value = 158, title = "Total no. of goals scored", icon = icon("futbol")) ))
valueBox() と infoBox() の派生:
valueBoxOutput() と infoBoxOutput()renderValueBox() と renderInfoBox() もあるvalueBox() と infoBox() が必要
body <- dashboardBody(
fluidRow(valueBoxOutput(outputId = "valuebox1"),
infoBoxOutput(outputId = "infobox1")
))
server <- function(input, output){
output$valuebox1 <- renderValueBox(
valueBox(3, "Total no. of red cards awarded",
icon = icon("user"), color = "red"))
output$infobox1 <- renderInfoBox(
infoBox(158,
title = "Total no. of goals scored",
icon = icon("futbol")))
}
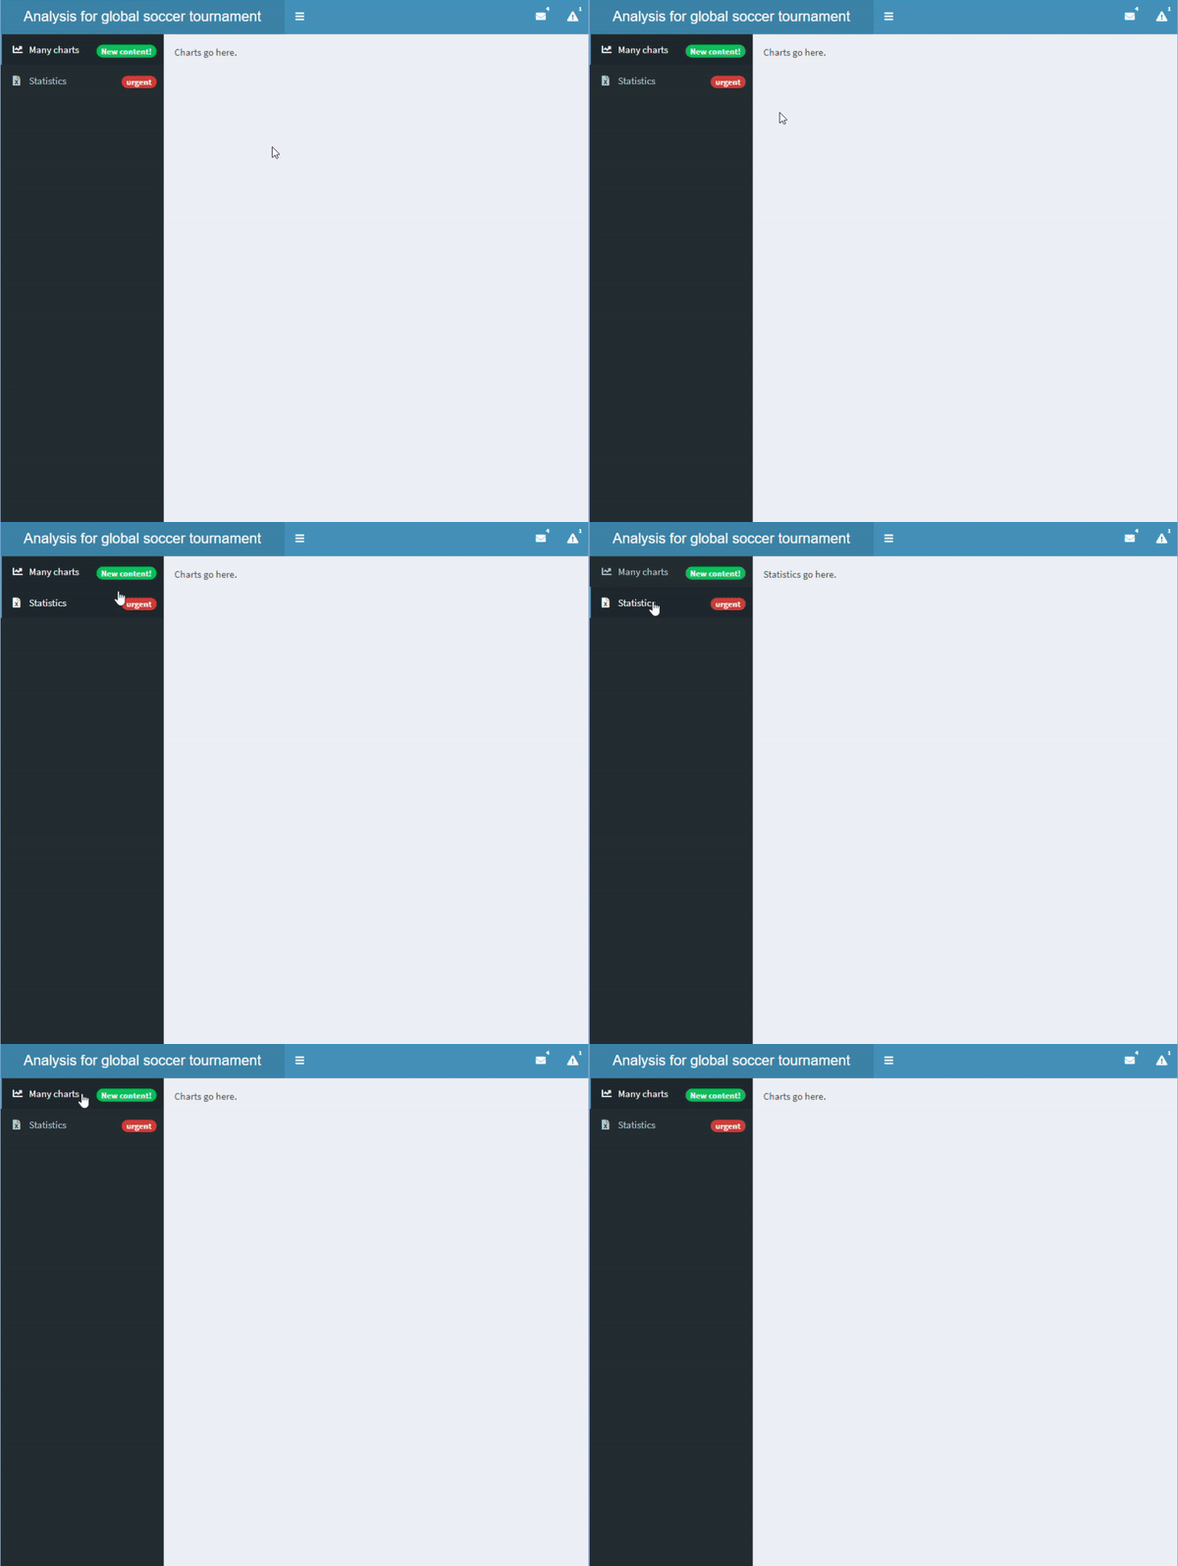
plotOutput():renderPlot():server() に配置ggplot() オブジェクトを含むvalueBoxOutput():renderValueBox():server() に配置valueBox() オブジェクトを含むtabItems() を追加tabItem() で定義menuItem() と tabItem() のラベルは一致させる
sidebar <- dashboardSidebar( sidebarMenu( id = "pages",menuItem("Many charts", tabName = "charts", icon = icon("chart-line"), badgeLabel = "New content!", badgeColor = "green"),menuItem("Statistics", icon = icon("file-excel"), tabName = "statistics", badgeLabel = "urgent", badgeColor = "red") ))body <- dashboardBody( tabItems(tabItem("charts", "Charts go here." ), tabItem("statistics", "Statistics go here." )))
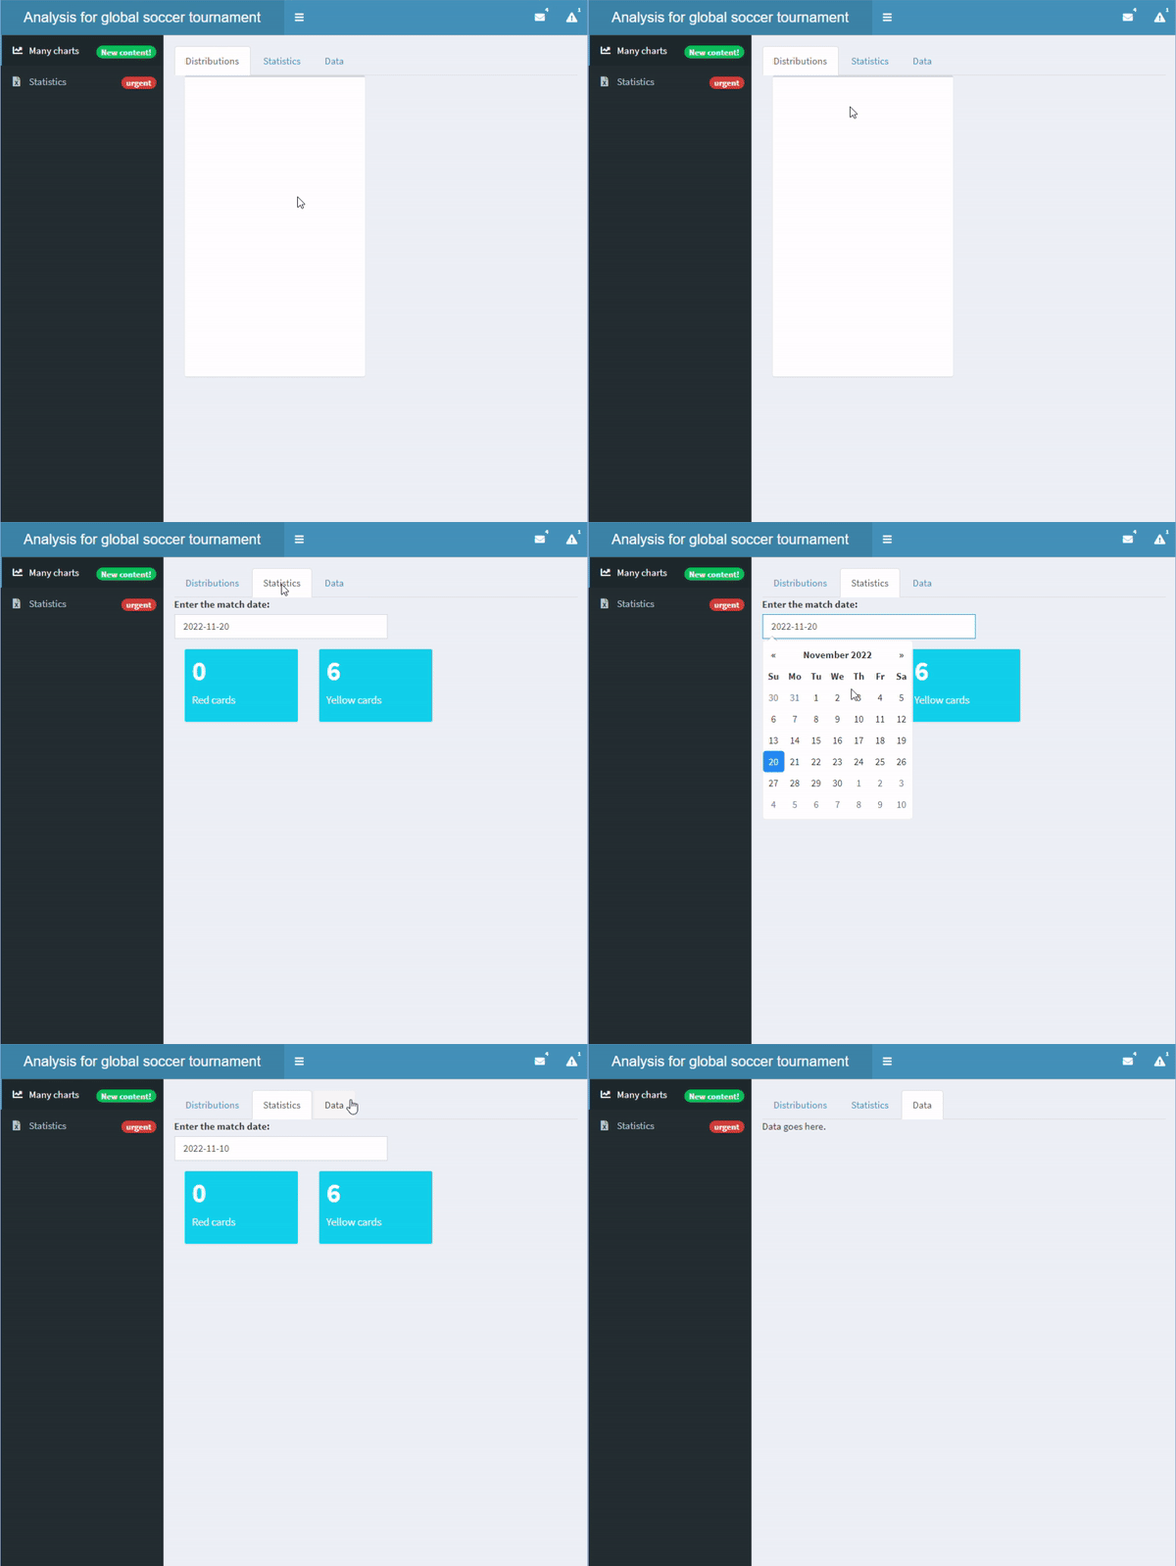
tabsetPanel() でもタブを定義可能tabPanel() で定義tabItems()/tabItem() と混同しない
body <- dashboardBody(tabsetPanel(tabPanel("Distributions", box(plotOutput("dist"))), tabPanel("Statistics", dateInput("matchdate", "Enter the match date:", value = "2022-11-20"), valueBoxOutput("red"), valueBoxOutput("yellow")), tabPanel("Data", "Data goes here.", tableOutput("data"))))server <- function(input, output){ output$red <- renderValueBox(valueBox(0, "Red cards")) output$yellow <- renderValueBox(valueBox(6, "Yellow cards")) }
shinydashboard で作るダッシュボード