棒グラフと点データ
R による可視化ベストプラクティス

Nick Strayer
Instructor
点データとは?
- カテゴリ軸と数値軸を1つずつ持つ
- カウント、平均、割合など
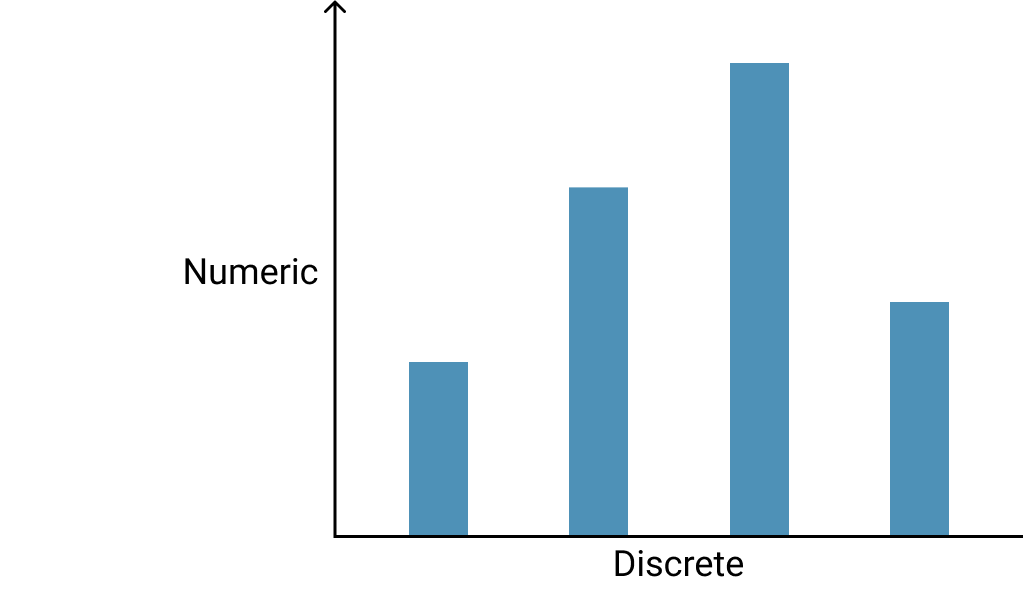
単一の観測値
- 何かの単一の観測値を表す
- 例:州の人口、細胞増殖率

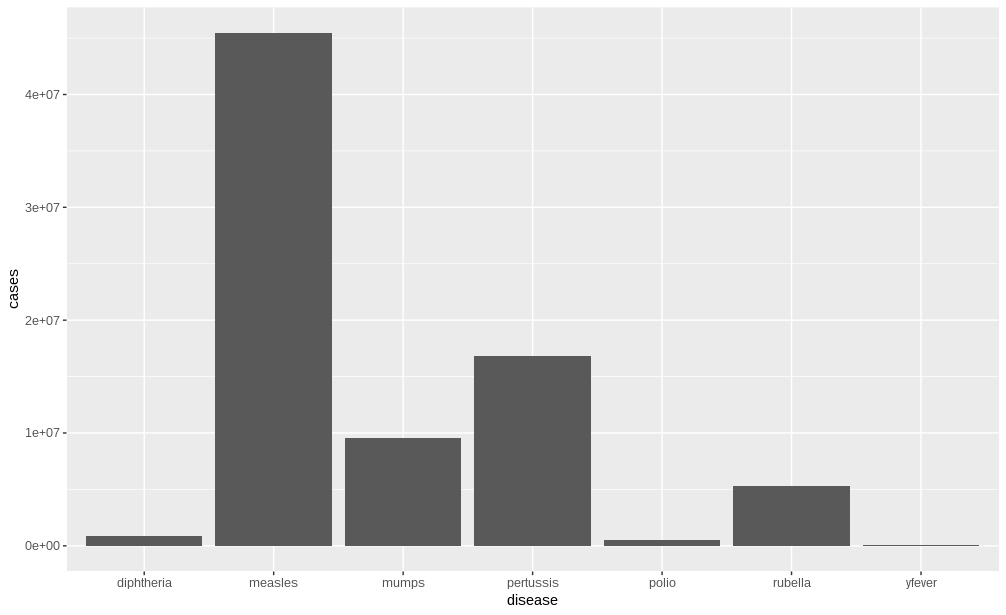
常に最適とは限らない
- 棒グラフは他のグラフのほうが適切な場面でも頻繁に使われる
- これを避けるために従うべきいくつかの原則がある

積み上げの原則
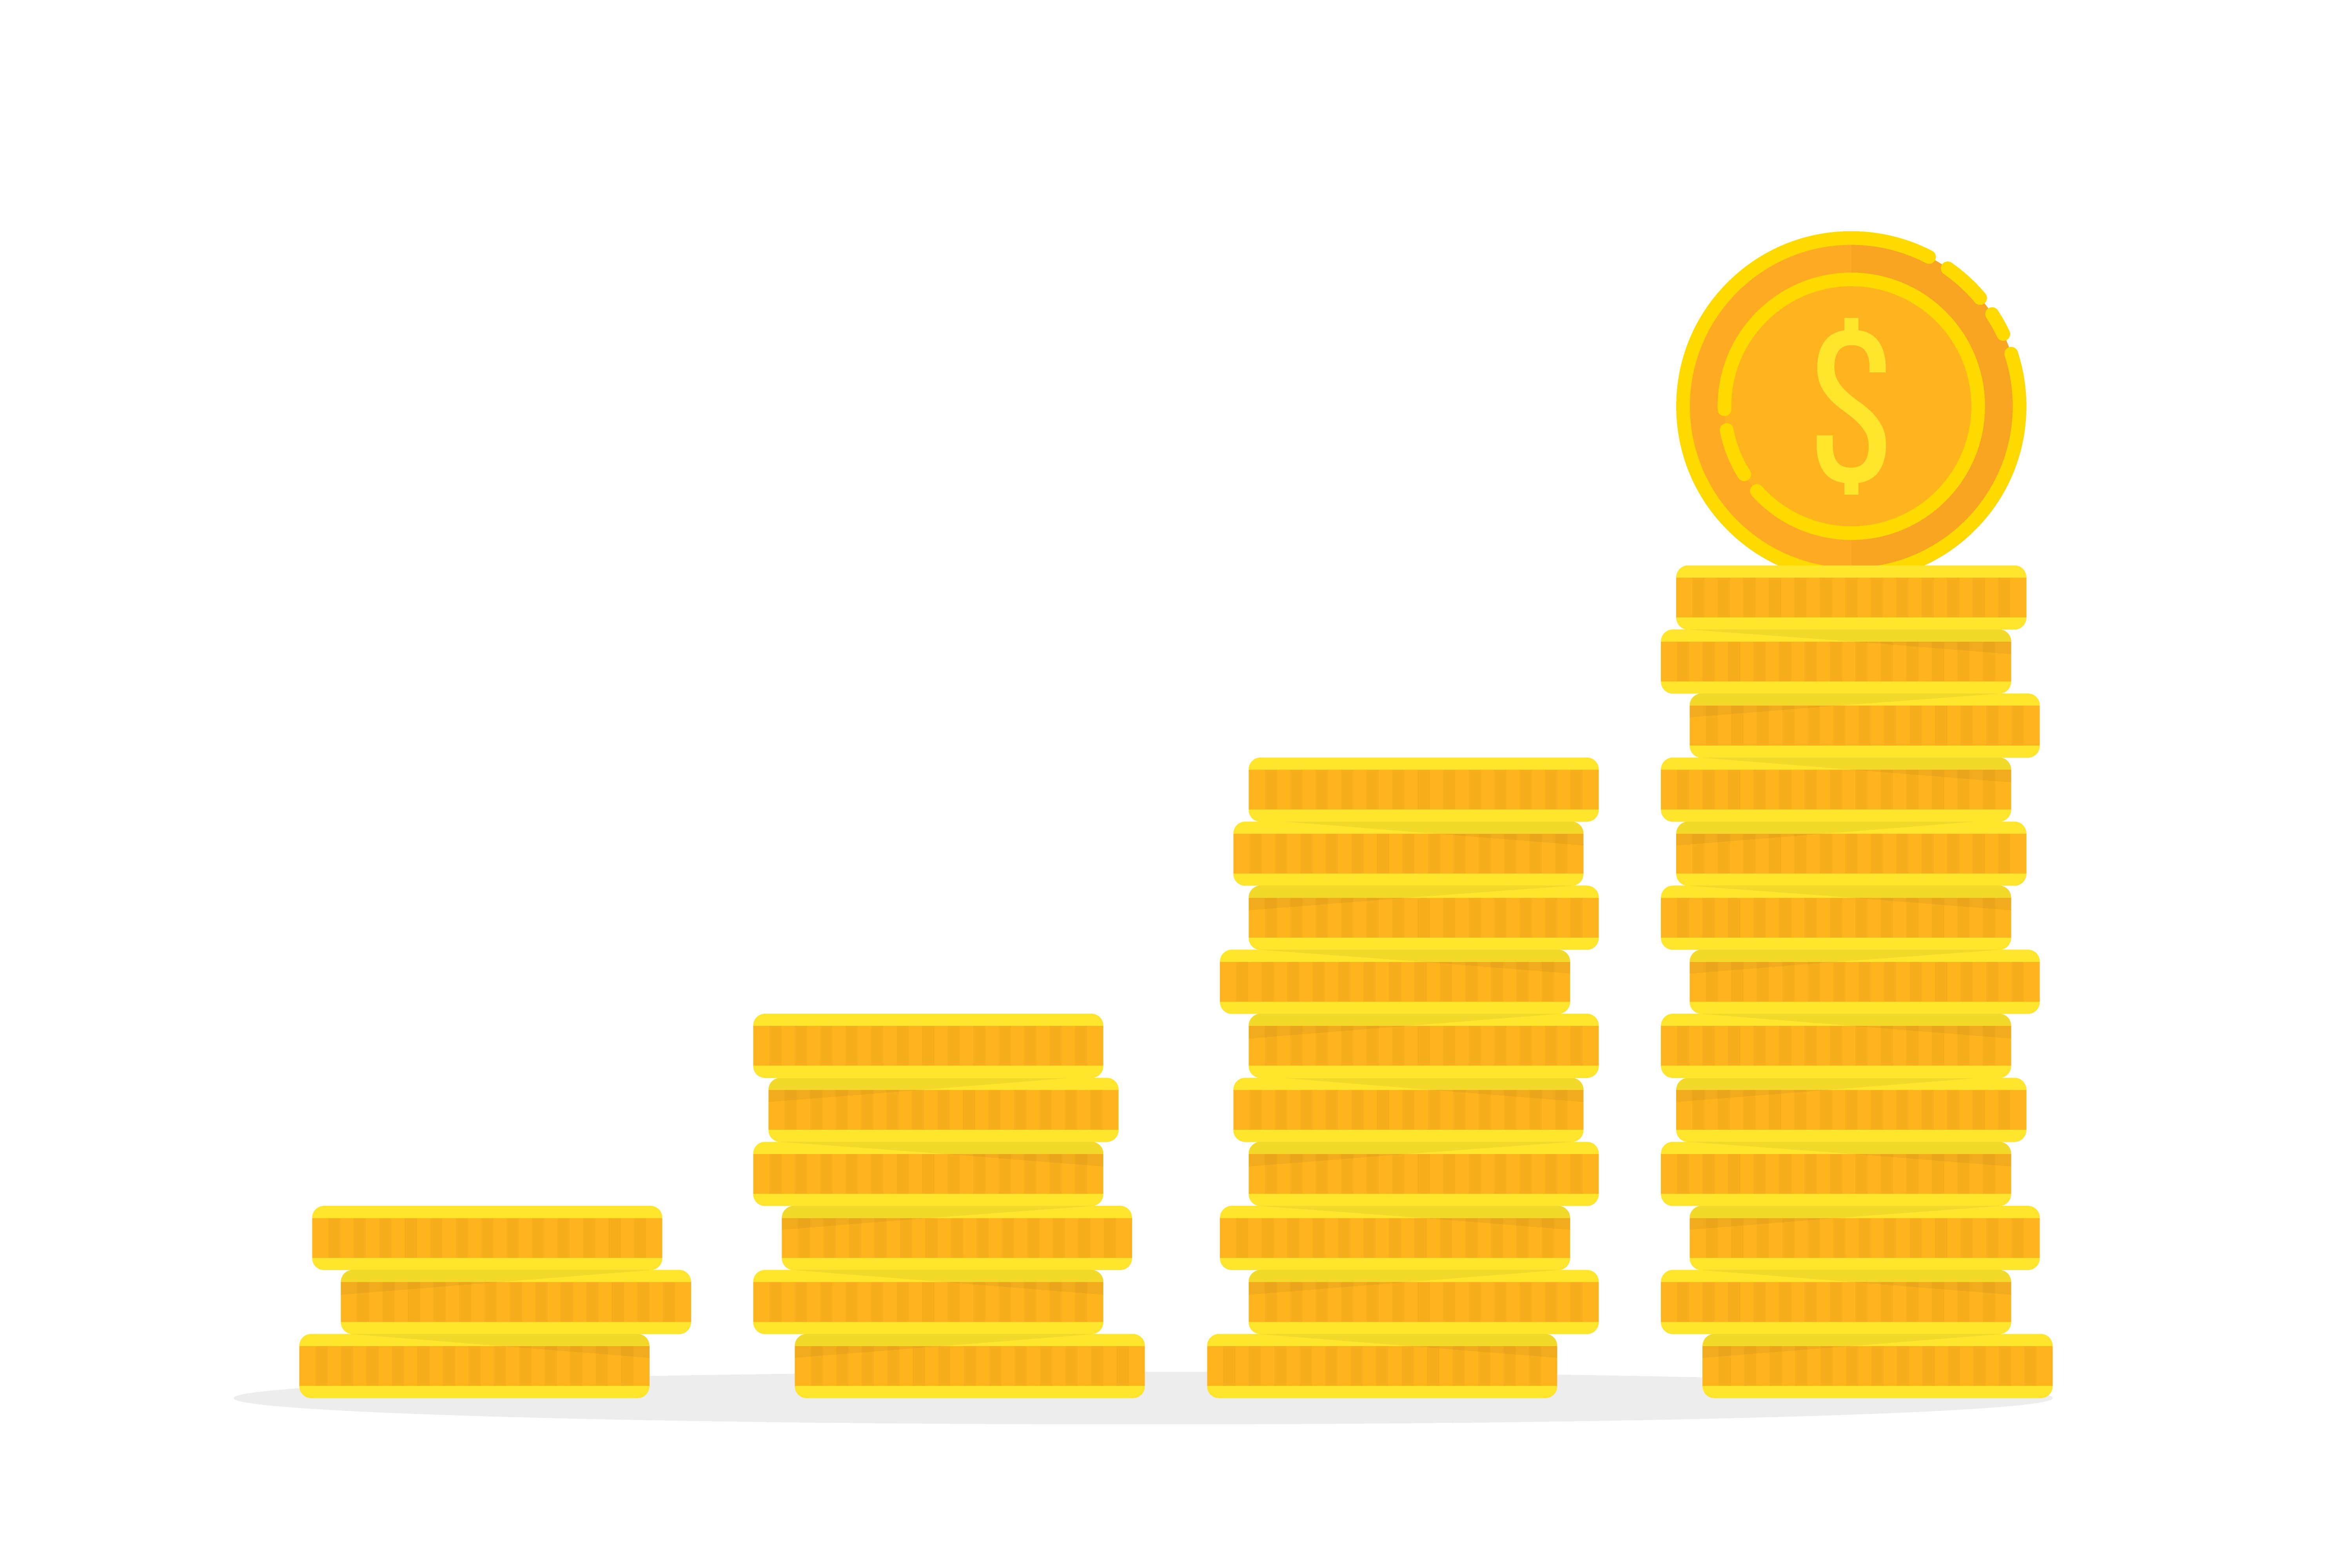
なぜ量的データなのか?
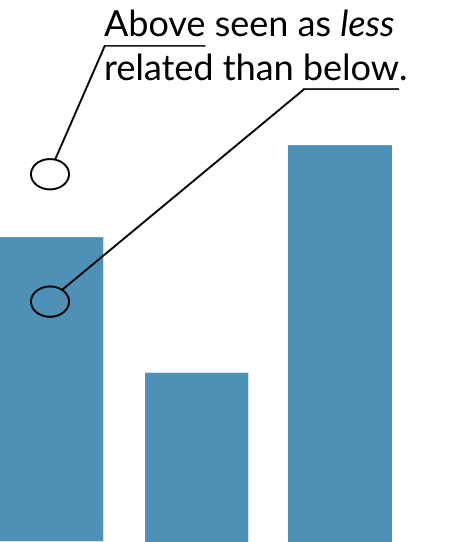
重大な問題か?

R による可視化ベストプラクティス
Nick Strayer
Instructor

