Rで学ぶ確率の基礎
David Robinson
Chief Data Scientist, DataCamp
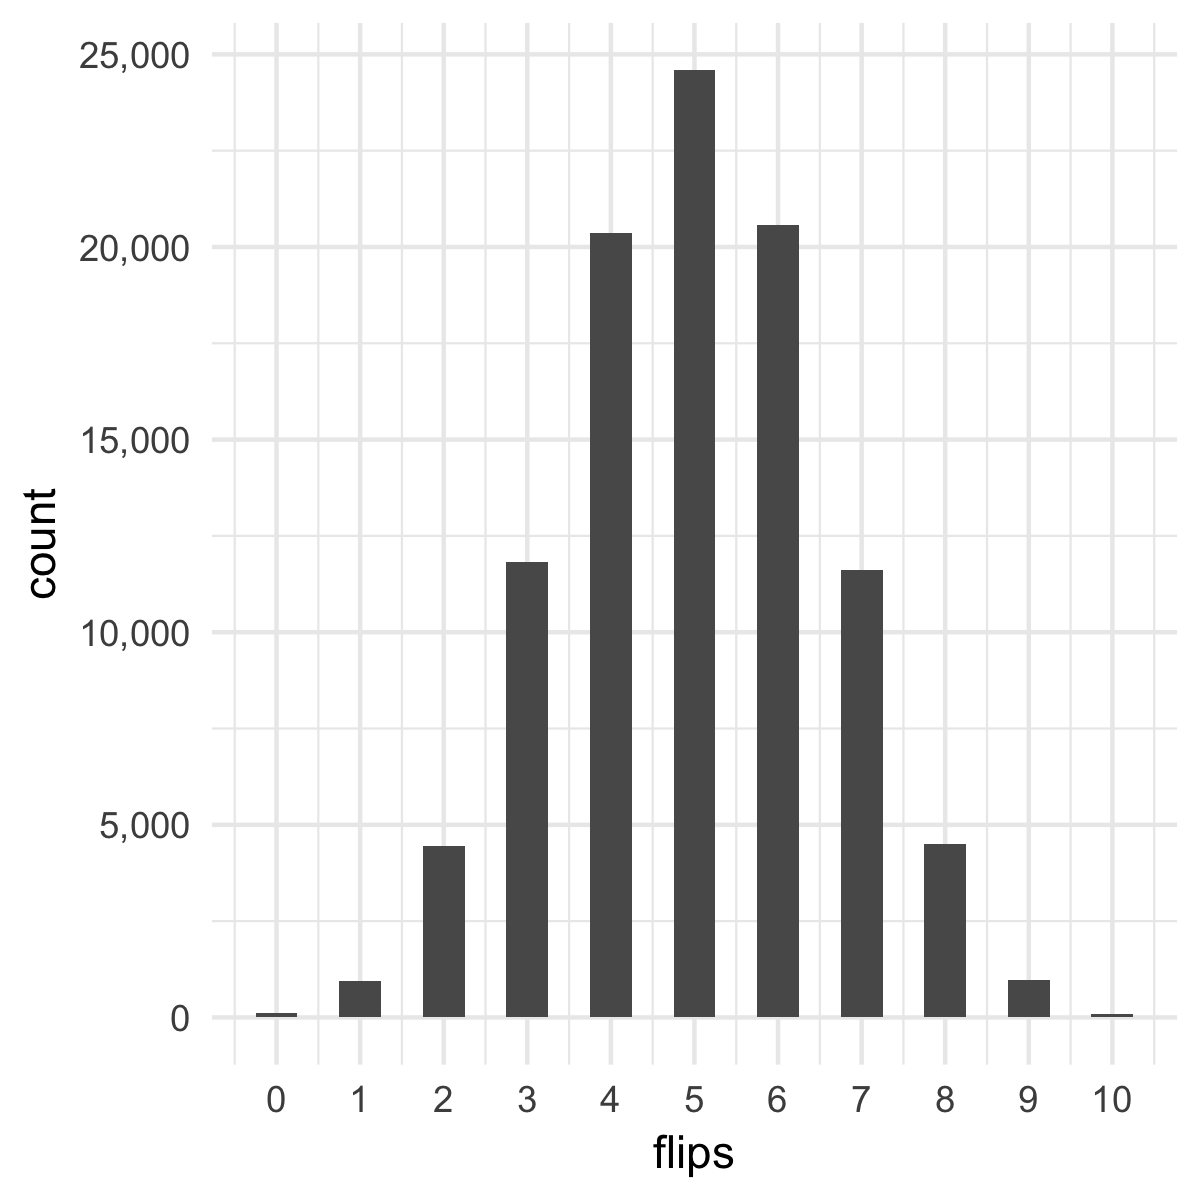
$$X \sim \text{Binomial}(10, .5)$$
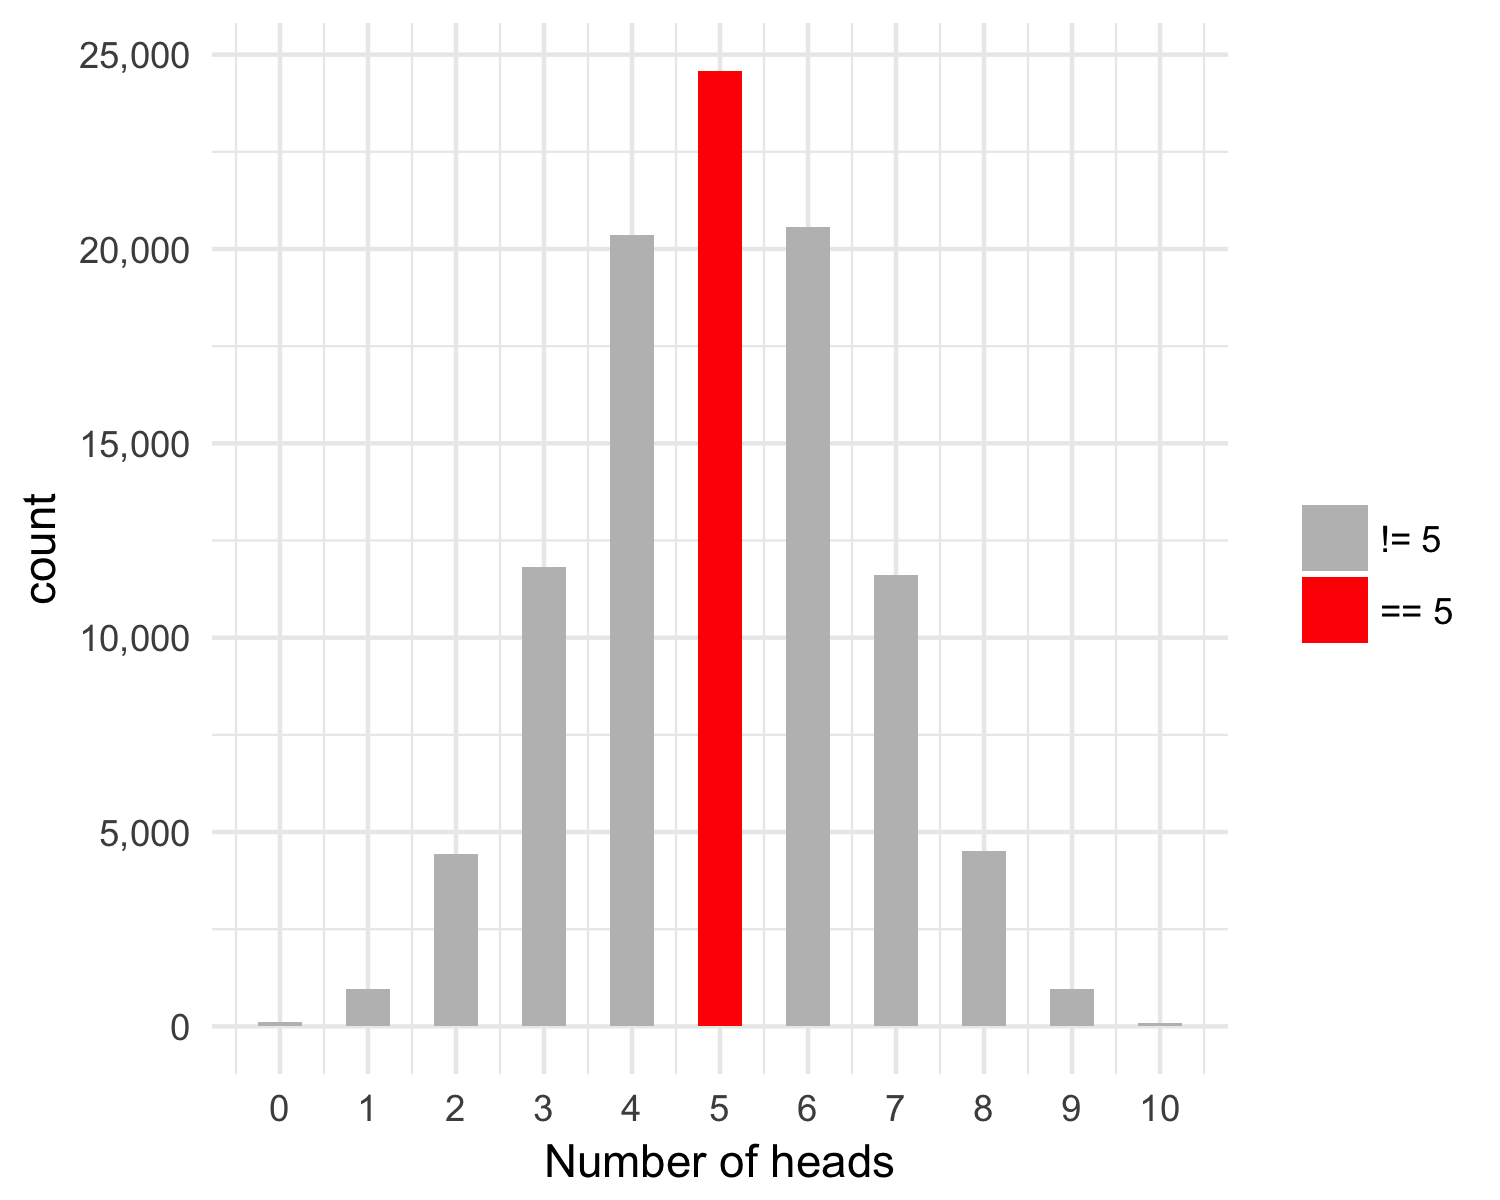
$$\Pr(X=5)$$
flips <- rbinom(100000, 10, .5)
flips == 5
# [1] FALSE TRUE FALSE FALSE...
mean(flips == 5)
# [1] 0.2463
dbinom(5, 10, .5)
# [1] 0.2460938
dbinom(6, 10, .5)
# [1] 0.2050781
dbinom(10, 10, .5)
# [1] 0.0009765625
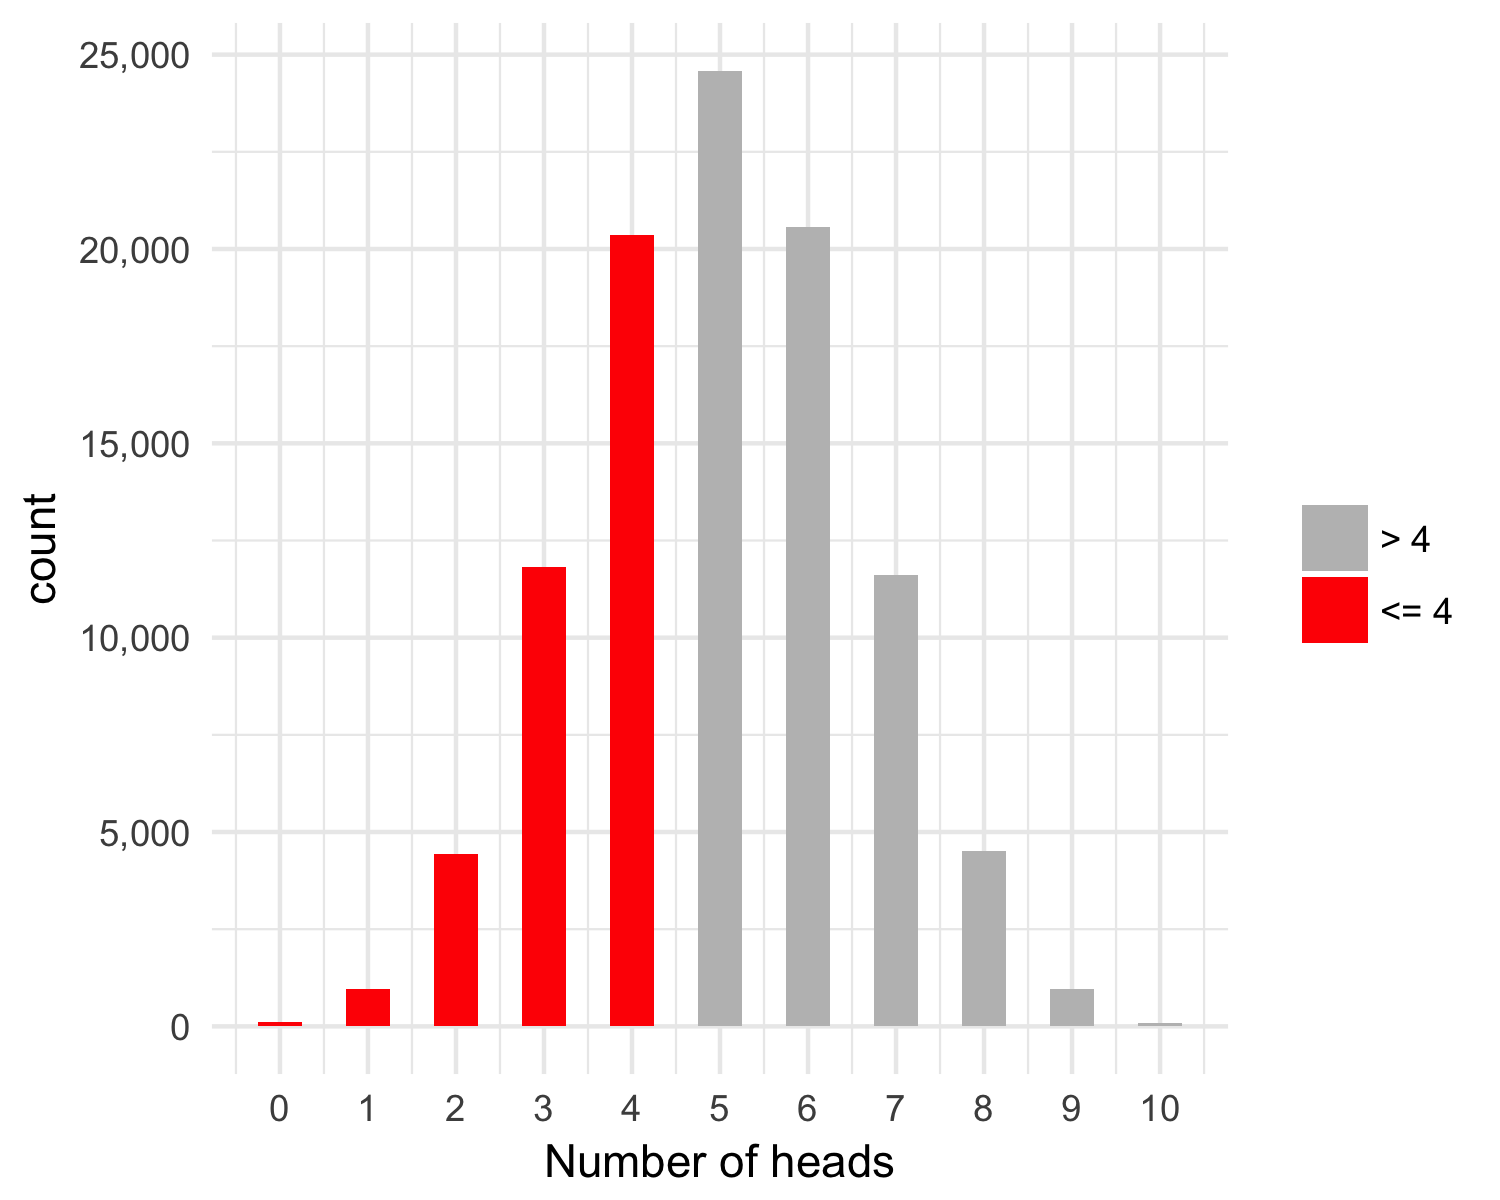
$$\Pr(X\leq 4)$$
flips <- rbinom(100000, 10, .5)
mean(flips <= 4)
# [1] 0.37682
pbinom(4, 10, .5)
# [1] 0.37695