A/Bテスト

Pythonで学ぶBayesianデータ分析

Michal Oleszak

Machine Learning Engineer

A/Bテスト

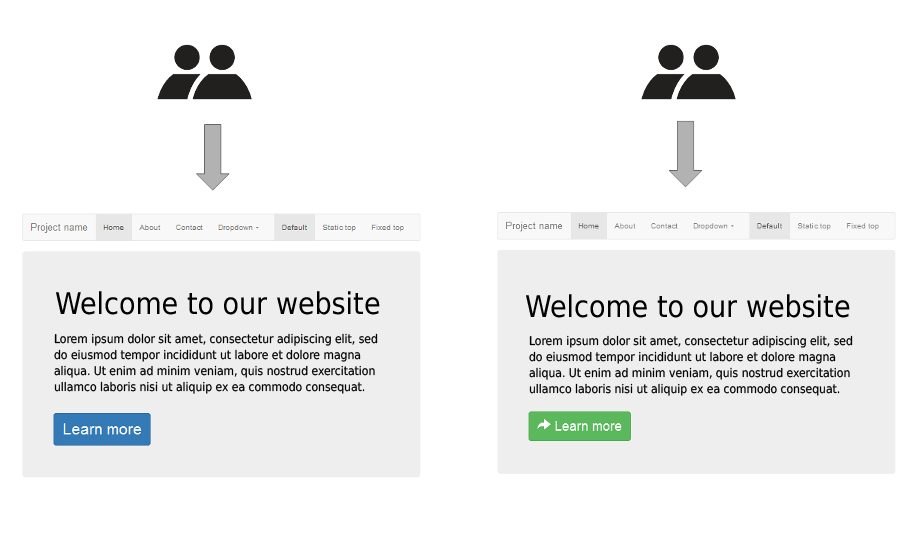
  • 無作為化実験:ユーザーを2群(A/B)に分ける


2つのユーザーグループ。

1 画像: https://commons.wikimedia.org/wiki/File:A-B_testing_simple_example.png の改変
Pythonで学ぶBayesianデータ分析

A/Bテスト

  • 無作為化実験:ユーザーを2群(A/B)に分ける
  • 各群に異なるバージョン(例:サイトのレイアウト)を提示する


2つのユーザーグループに異なるサイトレイアウトを提示。

1 画像: https://commons.wikimedia.org/wiki/File:A-B_testing_simple_example.png の改変
Pythonで学ぶBayesianデータ分析

A/Bテスト

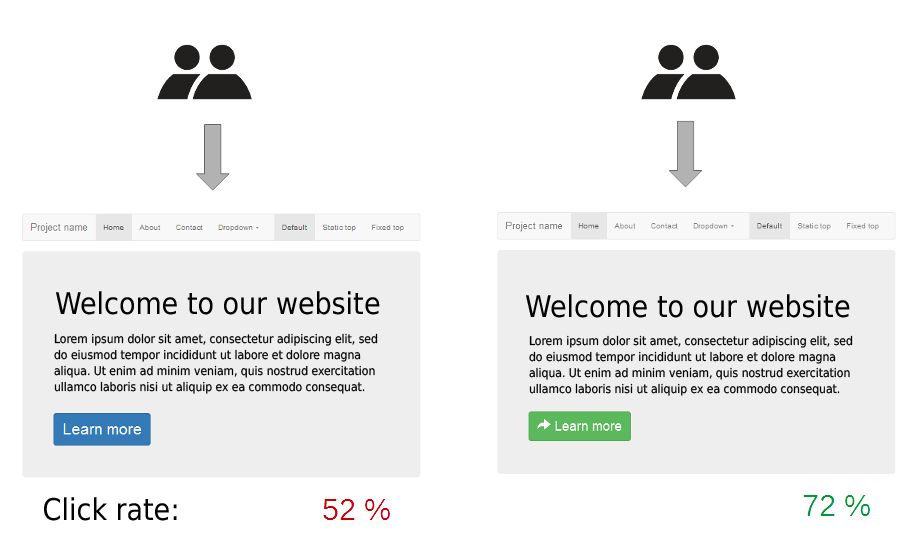
  • 無作為化実験:ユーザーを2群(A/B)に分ける
  • 各群に異なるバージョン(例:サイトのレイアウト)を提示
  • 指標(例:クリック率)でどちらが高いかを比較

2つのグループに異なるサイトレイアウトを提示し、一方のクリック率が高い図。

1 画像: https://commons.wikimedia.org/wiki/File:A-B_testing_simple_example.png の改変
Pythonで学ぶBayesianデータ分析

A/Bテスト:頻度主義的アプローチ

  • 仮説検定に基づく
  • AとBの性能が同じかを検証
  • AがBよりどれだけ良いかは示さない
Pythonで学ぶBayesianデータ分析

A/Bテスト:ベイズ的アプローチ

  • レイアウトA/Bの事後クリック率を計算して比較する
  • AがBより良い確率を直接計算する
  • どれだけ良いかを定量化する
  • 誤った判断時の期待損失を推定する
Pythonで学ぶBayesianデータ分析

A/Bテスト:ベイズ的アプローチ

  • ユーザーがサイトに来たとき、結果は2通り:
    • クリック(成功)
    • 非クリック(失敗)
  • 二項分布を用いる(成功確率=クリック率)
Pythonで学ぶBayesianデータ分析

ベータ事後分布のシミュレーション

事前分布が$Beta(a, b)$なら、事後分布は$Beta(x, y)$、ただし:

$x = \text{NumberOfSuccesses} + a$

$y = \text{NumberOfObservations} - \text{NumberOfSuccesses} + b$

def simulate_beta_posterior(trials, beta_prior_a, beta_prior_b):
    num_successes = np.sum(trials)
    posterior_draws = np.random.beta(
      num_successes + beta_prior_a, 
      len(trials) - num_successes + beta_prior_b, 
      10000
    )
    return posterior_draws
Pythonで学ぶBayesianデータ分析

事後分布の比較

1(クリック)と0(非クリック)のリスト:

print(A_clicks)
print(B_clicks)
[0 1 1 0 0 0 0 0 0 0 1 ... ]
[0 0 0 1 0 0 0 1 1 0 1 ... ]


各レイアウトの事後分布をシミュレーション:

A_posterior = simulate_beta_posterior(A_clicks, 1, 1)
B_posterior = simulate_beta_posterior(B_clicks, 1, 1)

事後分布を可視化:

sns.kdeplot(A_posterior, shade=True, label="A")
sns.kdeplot(B_posterior, shade=True, label="B")
plt.show()
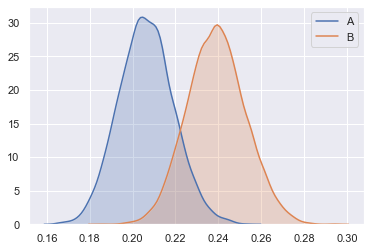
部分的に重なった2つの事後分布の密度プロット。

Pythonで学ぶBayesianデータ分析

事後分布の比較

BとAの事後差:

diff = B_posterior - A_posterior

sns.kdeplot(diff, shade=True, label="difference: A-B")
plt.show()
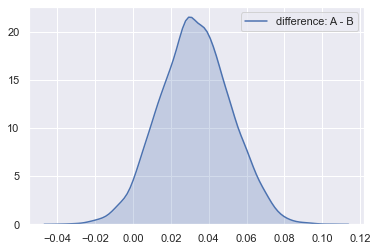
確率質量のほぼ全てが0より上にある密度プロット。

Bが優れる確率:

(diff > 0).mean()
0.9639
Pythonで学ぶBayesianデータ分析

期待損失

劣るバージョンを展開した場合、クリックは何件失うか?

# Aの方が良いときの差分(B-A)
loss = diff[diff < 0]


# 期待(平均)損失 expected_loss = loss.mean() print(expected_loss)
-0.0077850237030215215
Pythonで学ぶBayesianデータ分析

広告データ

print(ads)
                               user_id   product site_version                 time  banner_clicked
0     f500b9f27ac611426935de6f7a52b71f   clothes      desktop  2019-01-28 16:47:08               0
1     cb4347c030a063c63a555a354984562f  sneakers       mobile  2019-03-31 17:34:59               0
2     89cec38a654319548af585f4c1c76b51   clothes       mobile  2019-02-06 09:22:50               0
3     1d4ea406d45686bdbb49476576a1a985  sneakers       mobile  2019-05-23 08:07:07               0
4     d14b9468a1f9a405fa801a64920367fe   clothes       mobile  2019-01-28 08:16:37               0
...                                ...       ...          ...                  ...             ...
9995  7ca28ccde263a675d7ab7060e9ed0eca   clothes       mobile  2019-02-02 08:19:39               0
9996  7e2ec2631332c6c4527a1b78c7ede789   clothes       mobile  2019-04-04 03:27:05               0
9997  3b828da744e5785f1e67b5df3fda5571   clothes       mobile  2019-04-15 15:59:06               0
9998  6cce0527245bcc8519d698af2224c04a   clothes       mobile  2019-05-21 20:43:21               0
9999  8cf87a02f96327a1a8a93814f34d0d0c  sneakers       mobile  2019-03-02 21:27:57               0
Pythonで学ぶBayesianデータ分析

A/Bテストを実践しよう!

Pythonで学ぶBayesianデータ分析

Preparing Video For Download...